Over the past couple months, we’ve seen quite a bit of uncertainty and disagreement about how to apply the place=city and place=town tags in the U.S. I’d like to consolidate the backstory and walk you through some of the ideas I’ve explored for classifying places more systematically and deterministically, as well as the struggle to balance the needs of urban and rural parts of the country.
An early standard
From 2006 to 2013, the “core values” of place=* were globally defined by population on a logarithmic scale:
place=cityfor settlements with 100,000 inhabitants or moreplace=townfor settlements with between 10,000 and 100,000 inhabitantsplace=villagefor settlements with between 1,000 and 10,000 inhabitantsplace=hamletfor settlements with fewer than 1,000 inhabitants
There was plenty of debate about whether the rubric should be strictly based on population, legal designation, both, or neither. At one point, someone tried to reframe these population thresholds as merely a general observation about typical populations associated with each legal designation.
In 2009, the vast majority of place=* points in the U.S. were imported from GNIS. These points were classified based on the documented scale according to population data from the Census Bureau’s 2006 American Community Survey, falling back to place=hamlet if no matching entry in the ACS could be found.
GNIS turned out to have systemic errors. For example, old railroad stations and junctions were tagged as place=hamlet because both types of features had similar-looking labels on old USGS topographic maps:
The import compounded these problems. In the import, GNIS features were matched to ACS populations based on FIPS codes, but whereas GNIS distinguishes between populated places, administrative areas, and statistical census areas, the import tended to conflate these concepts. It also tended to conflate places with the same name, which distorted population figures of places across the Midwest (where a township and a place within often share a name) and New York State (where every town has a village by the same name, almost as a rule).
Accommodating local tastes
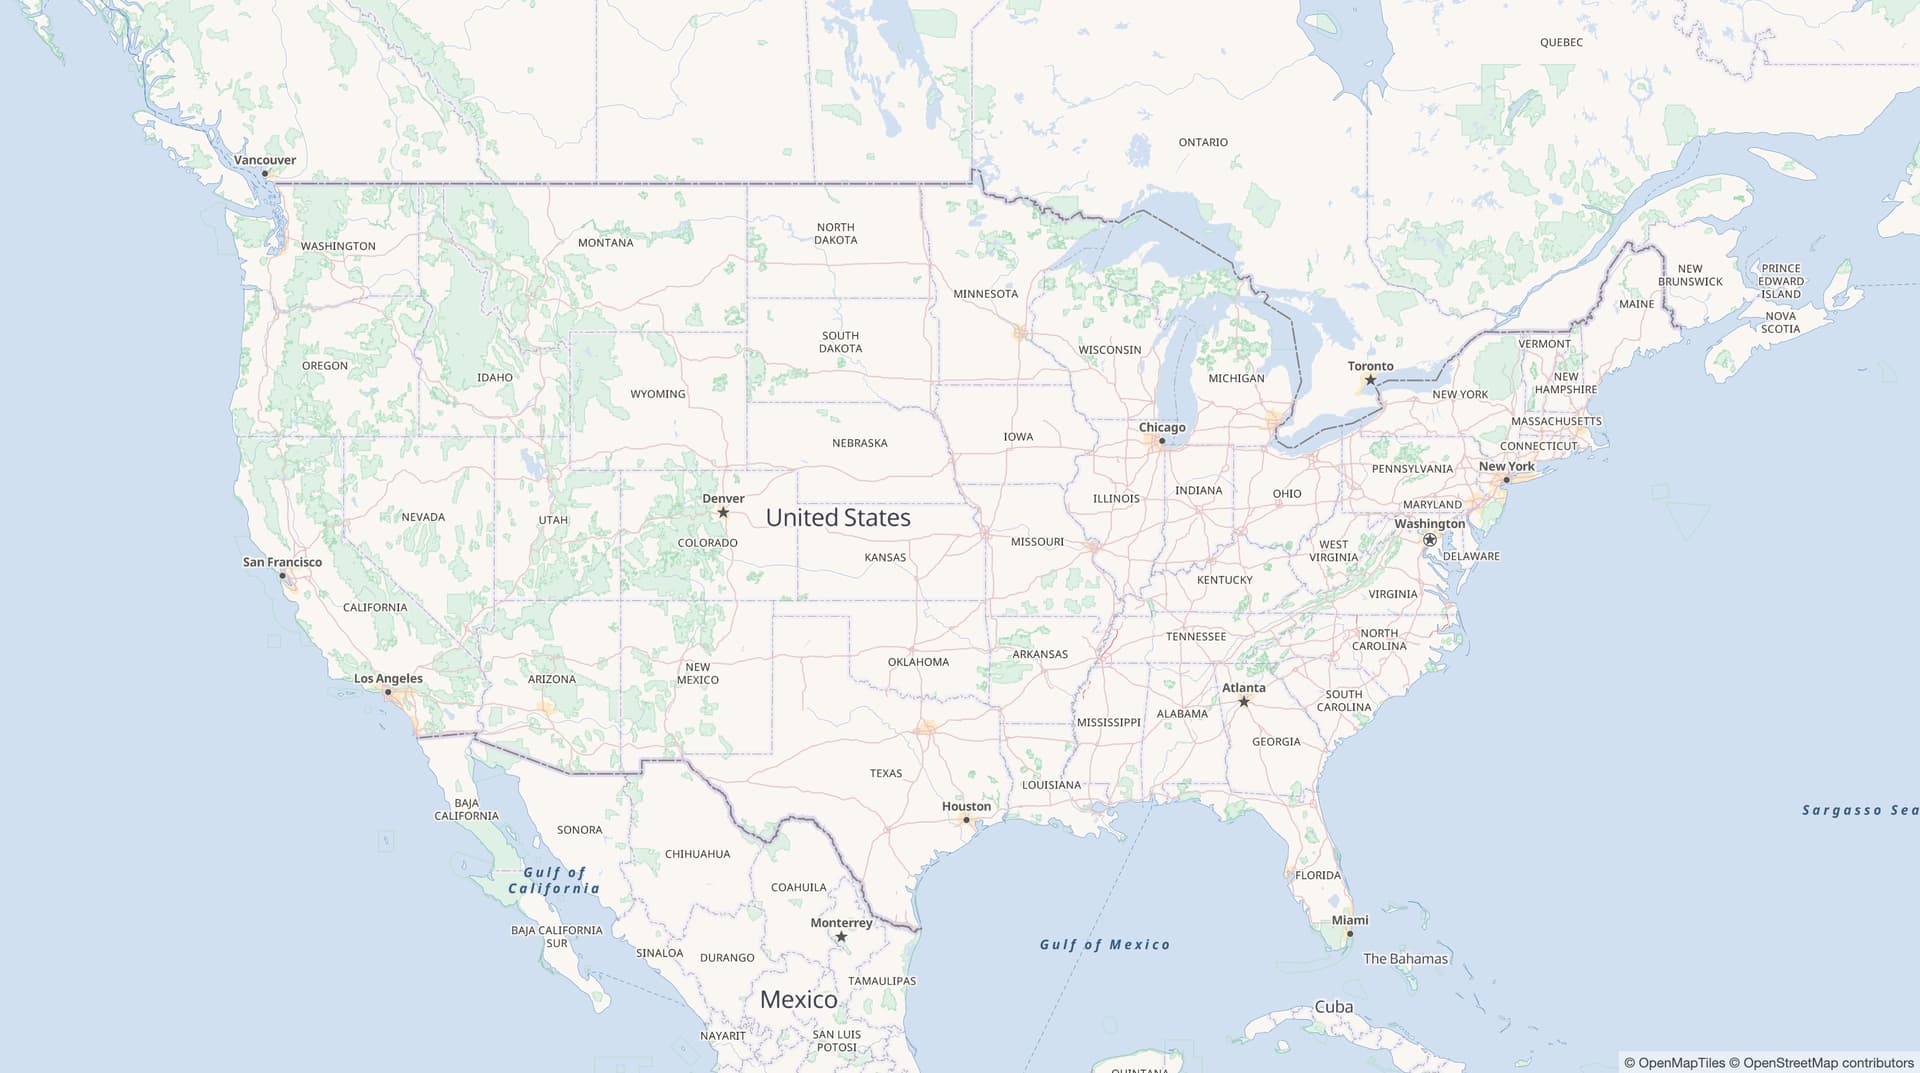
Even when an accurate match took place, the population figure only corresponds to the place’s incorporated territory. Boston is tagged with the population of the city proper, whereas a “Boston” label on any small-scale (zoomed-out) map represents the entire metropolitan area, including the suburbs. Worse, the “city”, “town”, and “village” terminology misleads many new mappers into thinking that places should be classified based on their official designations, particularly in states where these terms carry legal meaning. Changes along these lines rarely lasted long because they made the map look bizarre, especially across state lines.
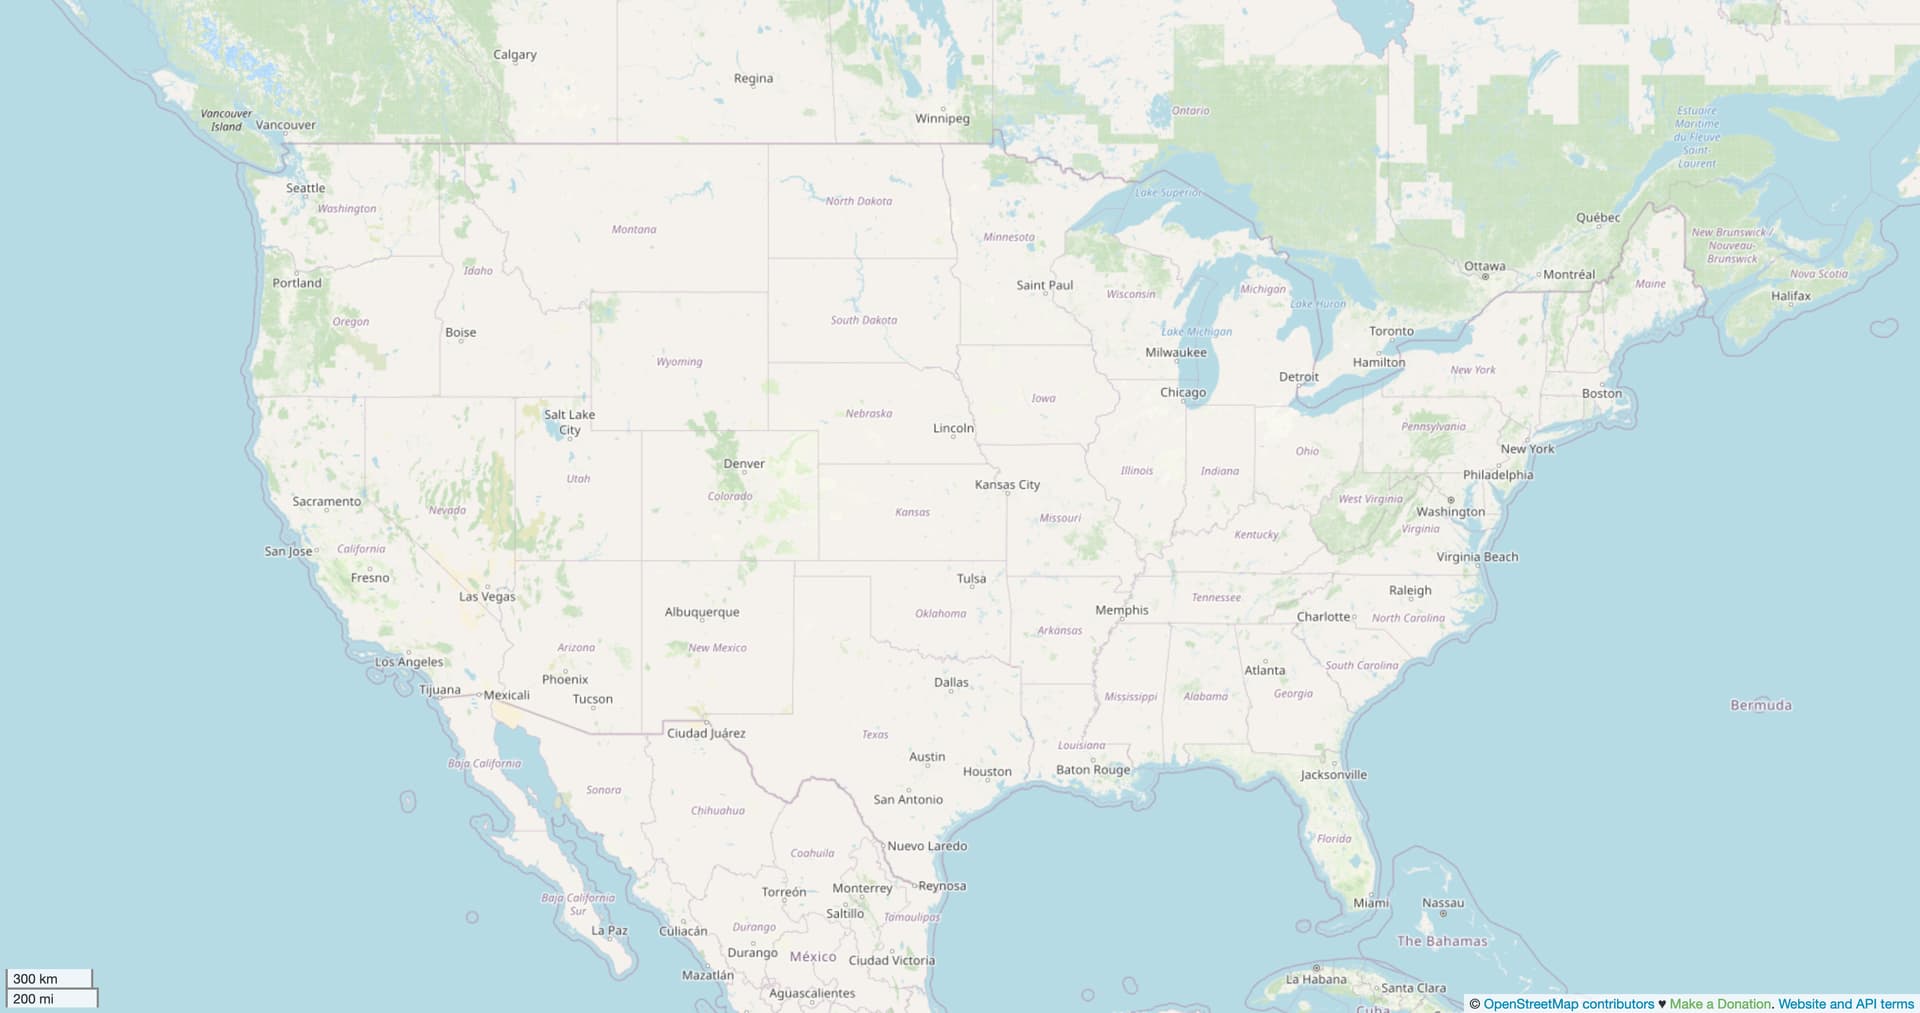
A more holistic approach still leaves something to be desired. Some state capitals and county seats are tiny compared to their peers, but to many mappers, they deserve equal treatment. And look at all this empty space – is OSM saying there’s nothing there but trees, if that?
The U.S. documentation continued to mention the logarithmic population scale long after it disappeared from the global documentation. Nevertheless, mappers in some regions adopted rubrics for reclassifying places based on some exceptions to this scale. Some boosted county seats, so that renderers would show the full set of administratively similar places at the same zoom level. Others tried to account for the majority of the urban population living in the suburbs, outside the incorporated city limits. Still others arbitrarily promoted places to fill in perceived gaps.
Generally, these have been ad hoc adjustments, with the unwritten expectation that any change to existing classifications is drastic enough to warrant prior discussion with the local community. And so launched scores of long discussions, often in response to mass edits and mass reversions. But there is very little coordination. If anything, we have created a visual demonstration of the “Lake Wobegon effect”: every place is of above-average importance to someone.
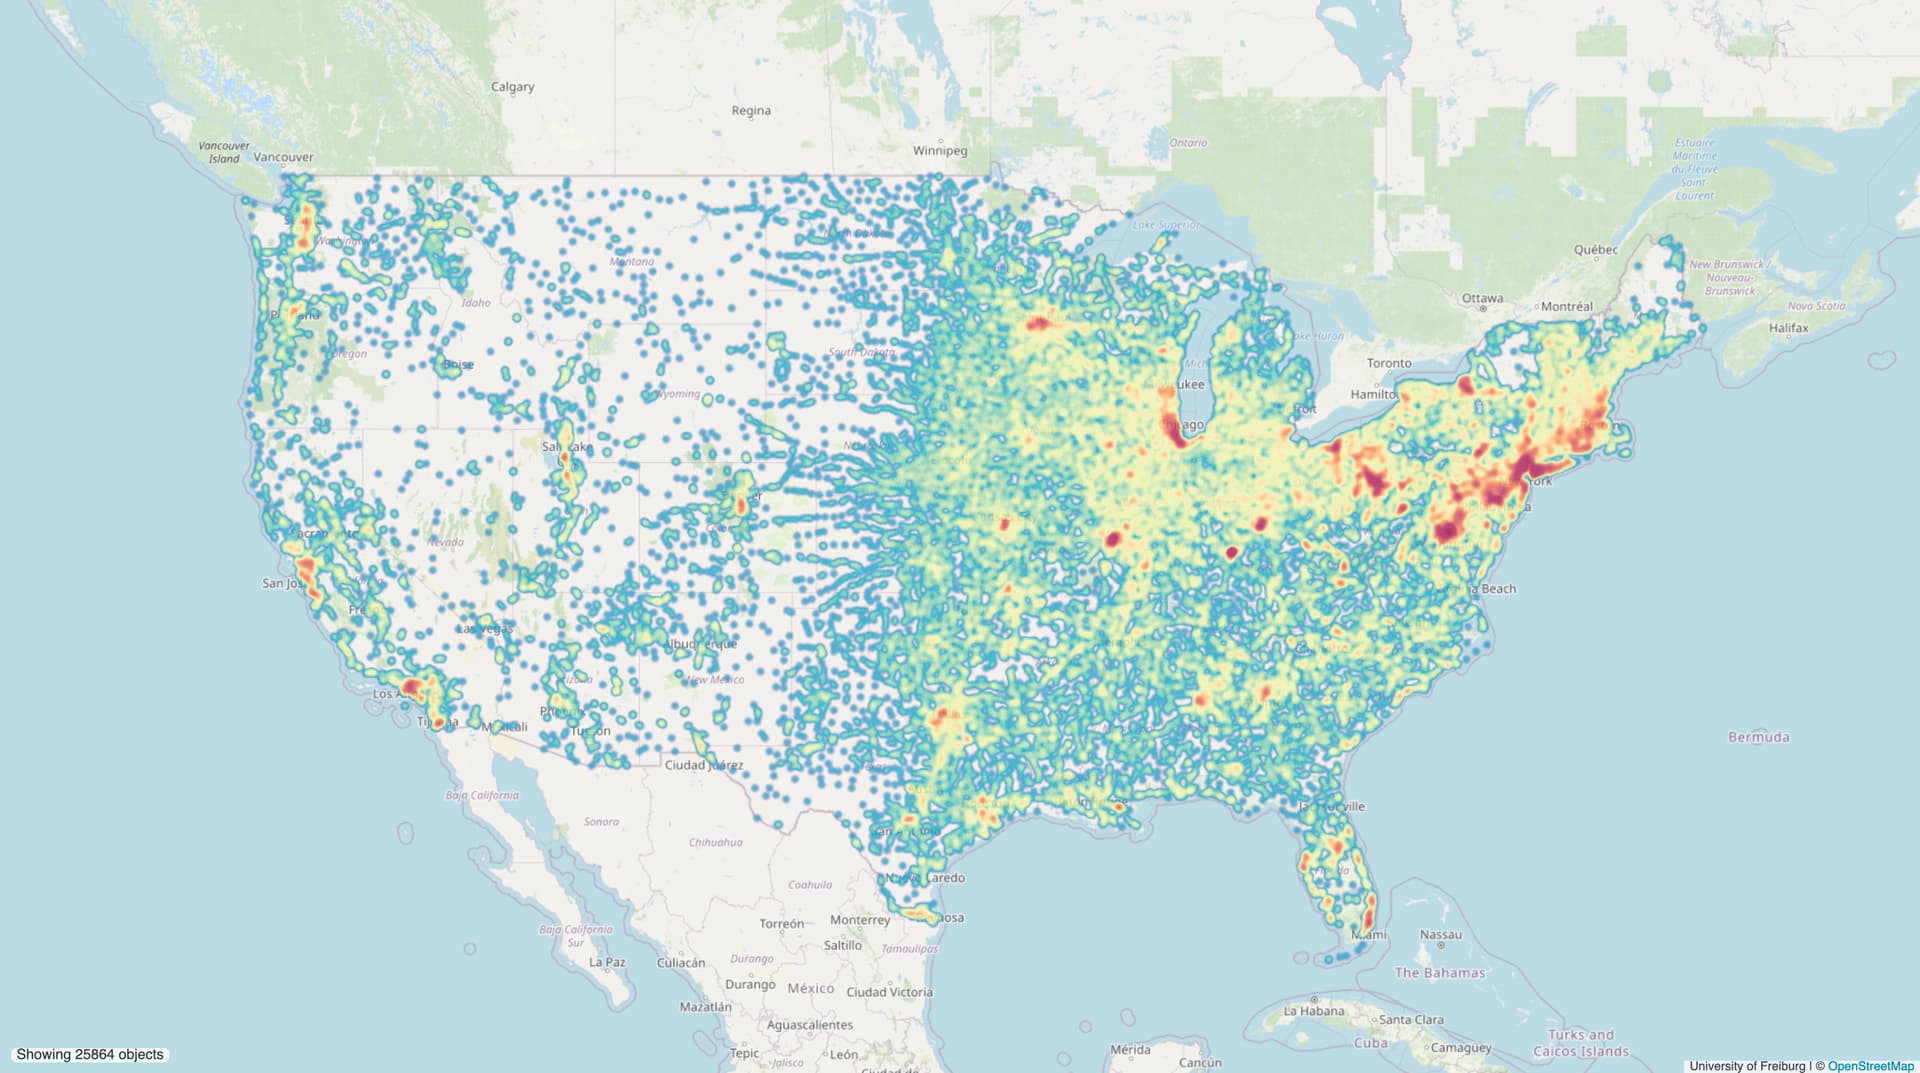
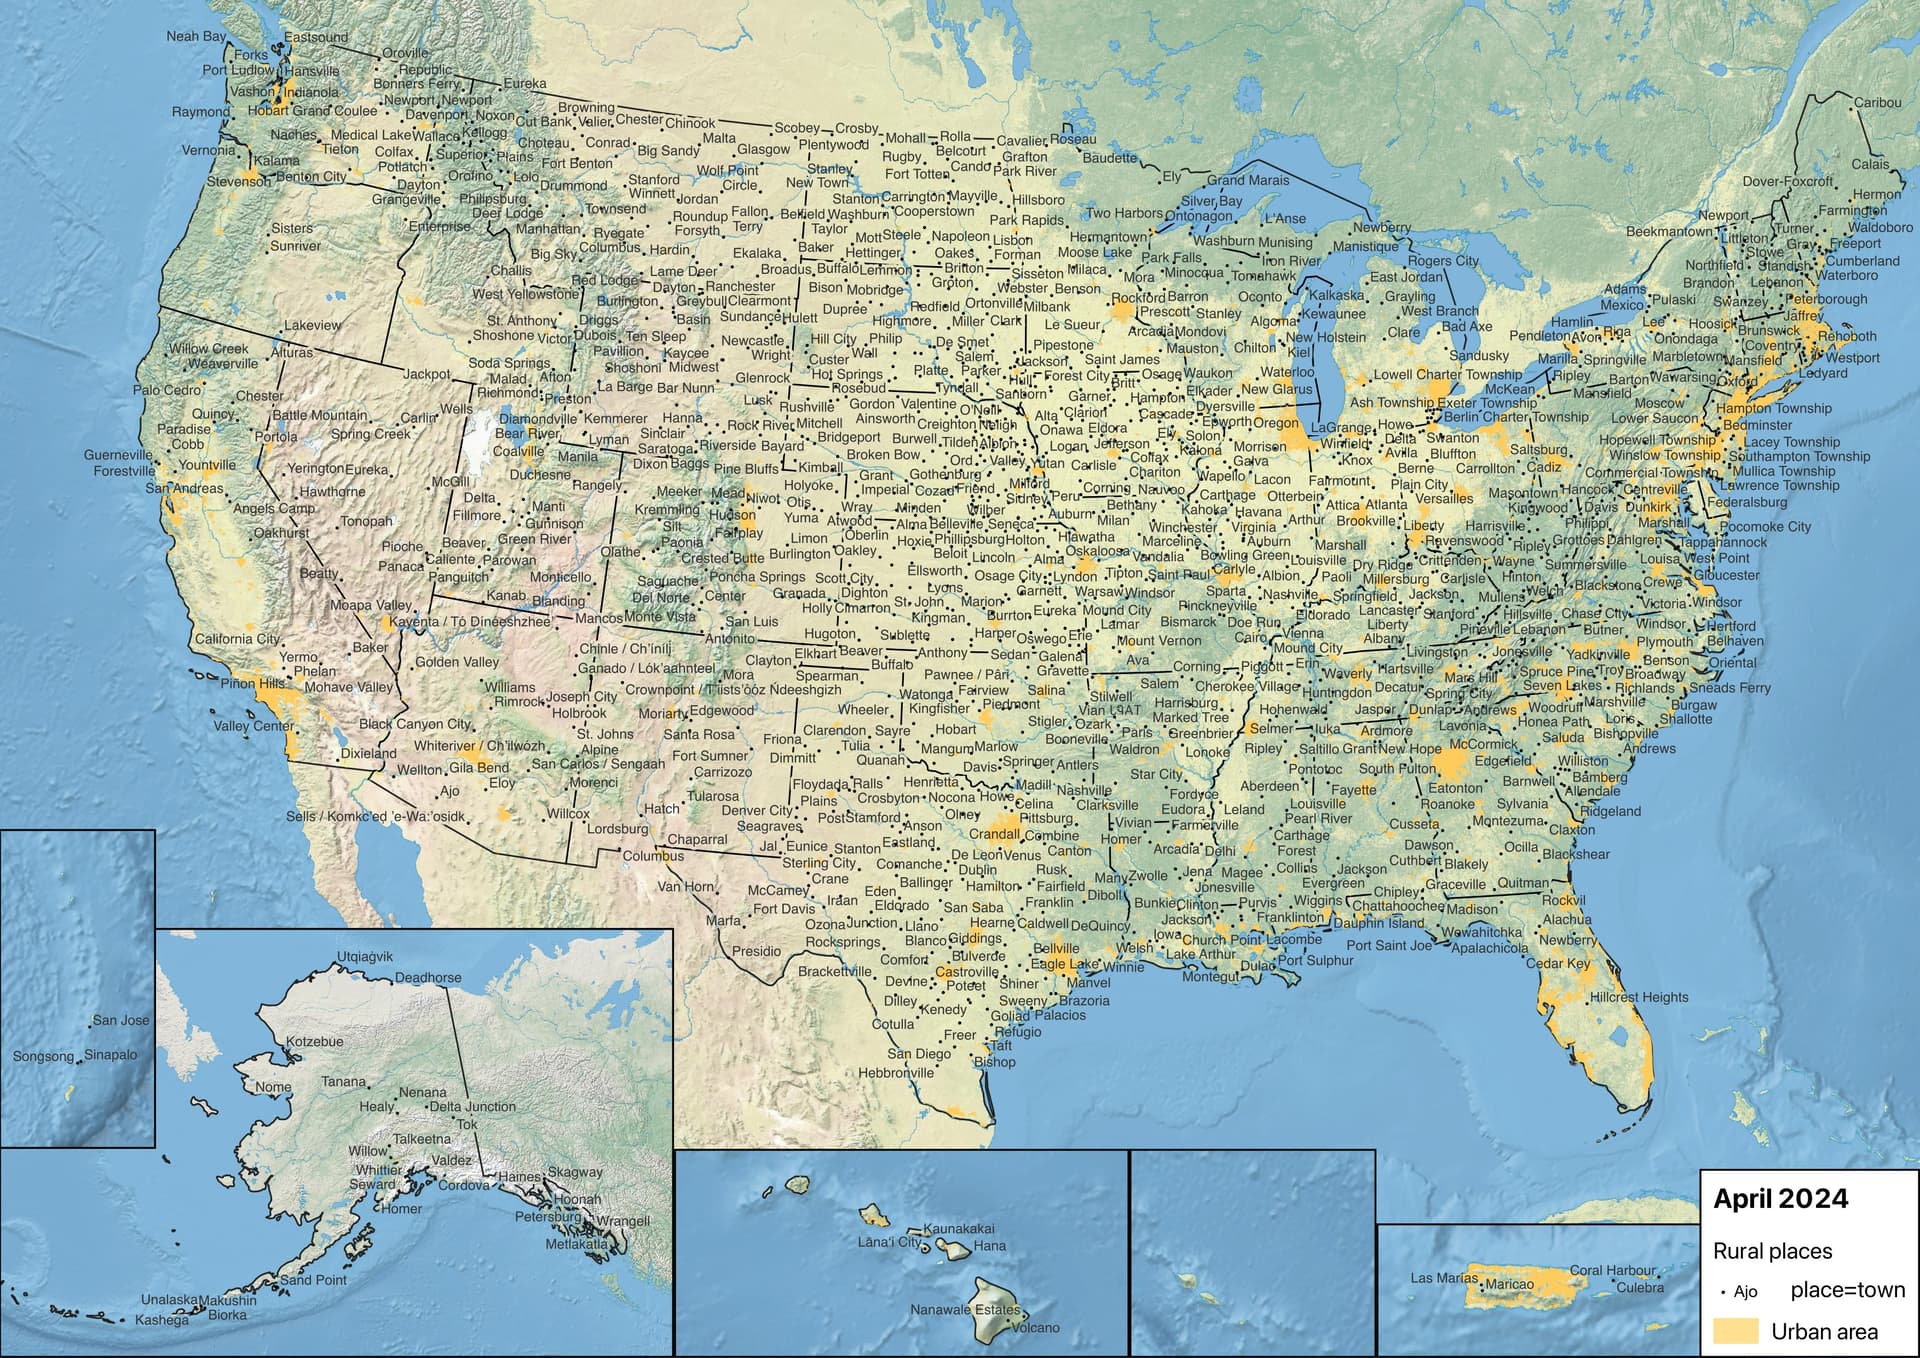
It should come as no surprise that there are more place=city nodes in the eastern half of the country and along the West Coast than in the Rockies. However, I can’t help but wonder what the large mass of city in Southern California has to do with the smaller clusters of city along the Bos–Wash corridor and the specks of city in Montana.
In 2017, there was an attempt to formalize many of these exceptions. On a wiki page unrelated to place classification, the minimum threshold for place=city was halved to 50,000 for unincorporated areas. By 2022, this became the documented standard for all place=city in the country. I was unable to find any discussion about this change, which might explain why mappers have implemented it inconsistently: of the places between 50,000 and 100,000 in population, 233 are place=town and 265 are place=city.
We need a system
Over the years, many mappers have expressed dissatisfaction that OSM’s place classification system is unclear, poorly documented, arbitrary, or based on unwritten rules. To some extent, they’re right: many places that aren’t classified according to a population scale essentially either got reclassified under the radar or were curated based on handshake agreements behind closed doors (such as PMs on osm.org or more public threads on Discord or Slack). This leaves us with little that we can document for newcomers to make sense of. They want something that, if not straightforward, is at least explainable.
A systematic approach to place classification isn’t just for wannabe urban planners in armchairs. Data consumers would be able to use place nodes more effectively and creatively if there’s some rhyme or reason to how they’re tagged. Cartographers want to declutter conurbations, but all they have is the sledgehammer of ranking by population and enforcing a minimum distance between labels – or eschewing OSM data in favor of Natural Earth at certain zoom levels. They need more context with which to make these decisions, which the place=city tag could provide if applied more judiciously.
Most OSM-based renderers are poor tools for evaluating our place classification choices. Interactive maps don’t try very hard to show a coherent selection of place labels at each zoom level. At low zoom levels, they only need to show enough place labels to suggest further detail that you can access by zooming in. They tend not to label places any more aggressively than that, because otherwise the map starts to fill up with insignificant places that are tagged similarly. In an already sparsely populated region, this approach creates a perverse incentive for mappers to inflate classifications just so that a bare minimum number of places show up on the map, to achieve a minimal level of usability.
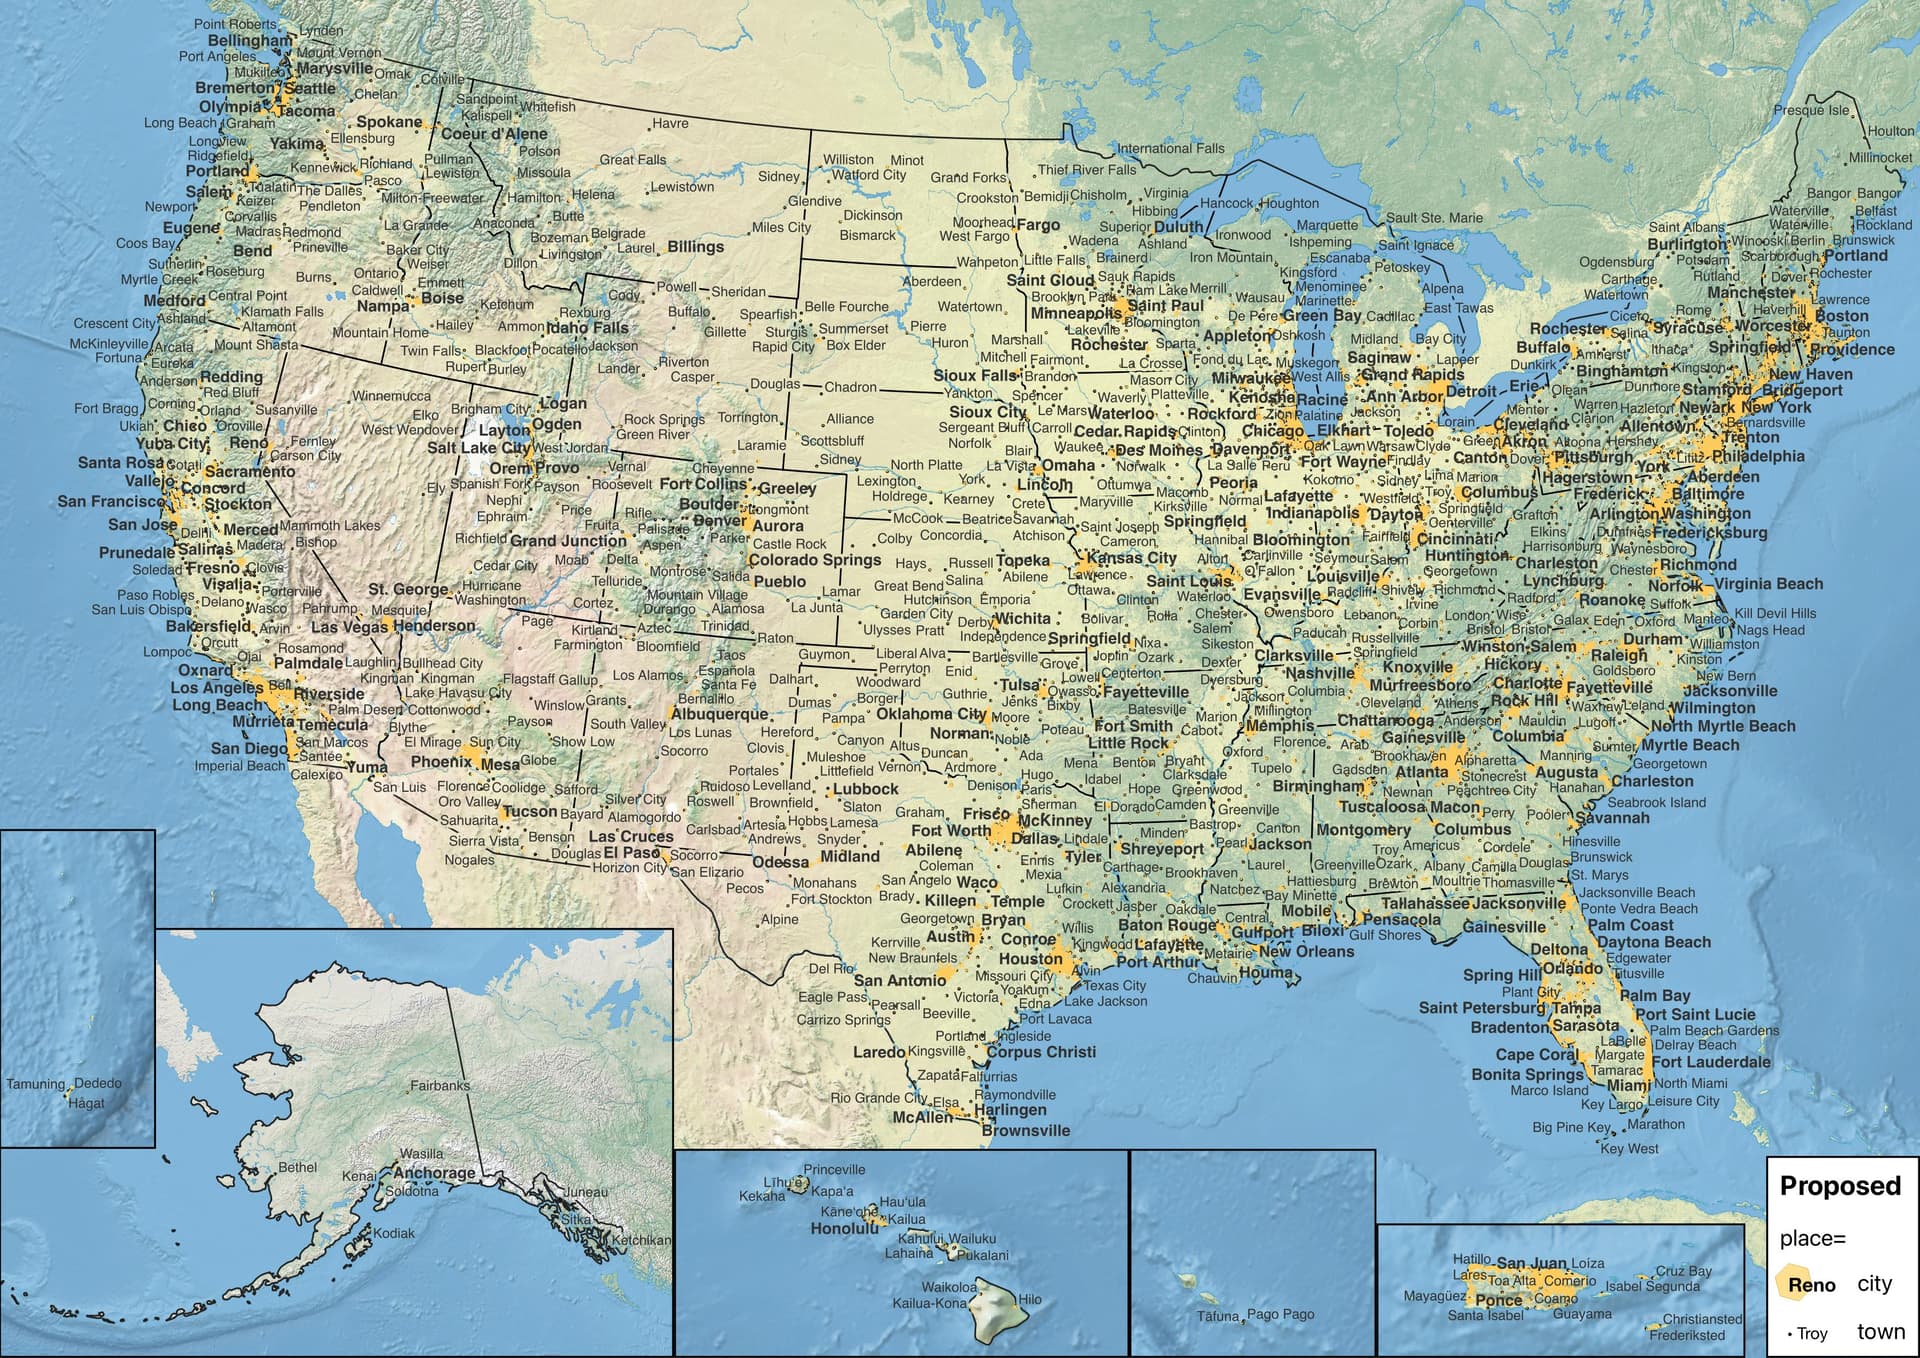
Not every renderer is interactive. There’s still an enduring need for static renders that get incorporated into slide decks, news articles, doctoral theses, textbooks, and other printed material. Many static maps preserve the traditional practice of filling in the gaps with labels that you’d normally see after zooming in. With this higher information density, there’s an even greater need to establish a visual hierarchy, to prevent information overload. Sometimes the reader needs to be able to glance at the map to see what’s most significant; other times, they need to be able to obtain more details by squinting at the same map.
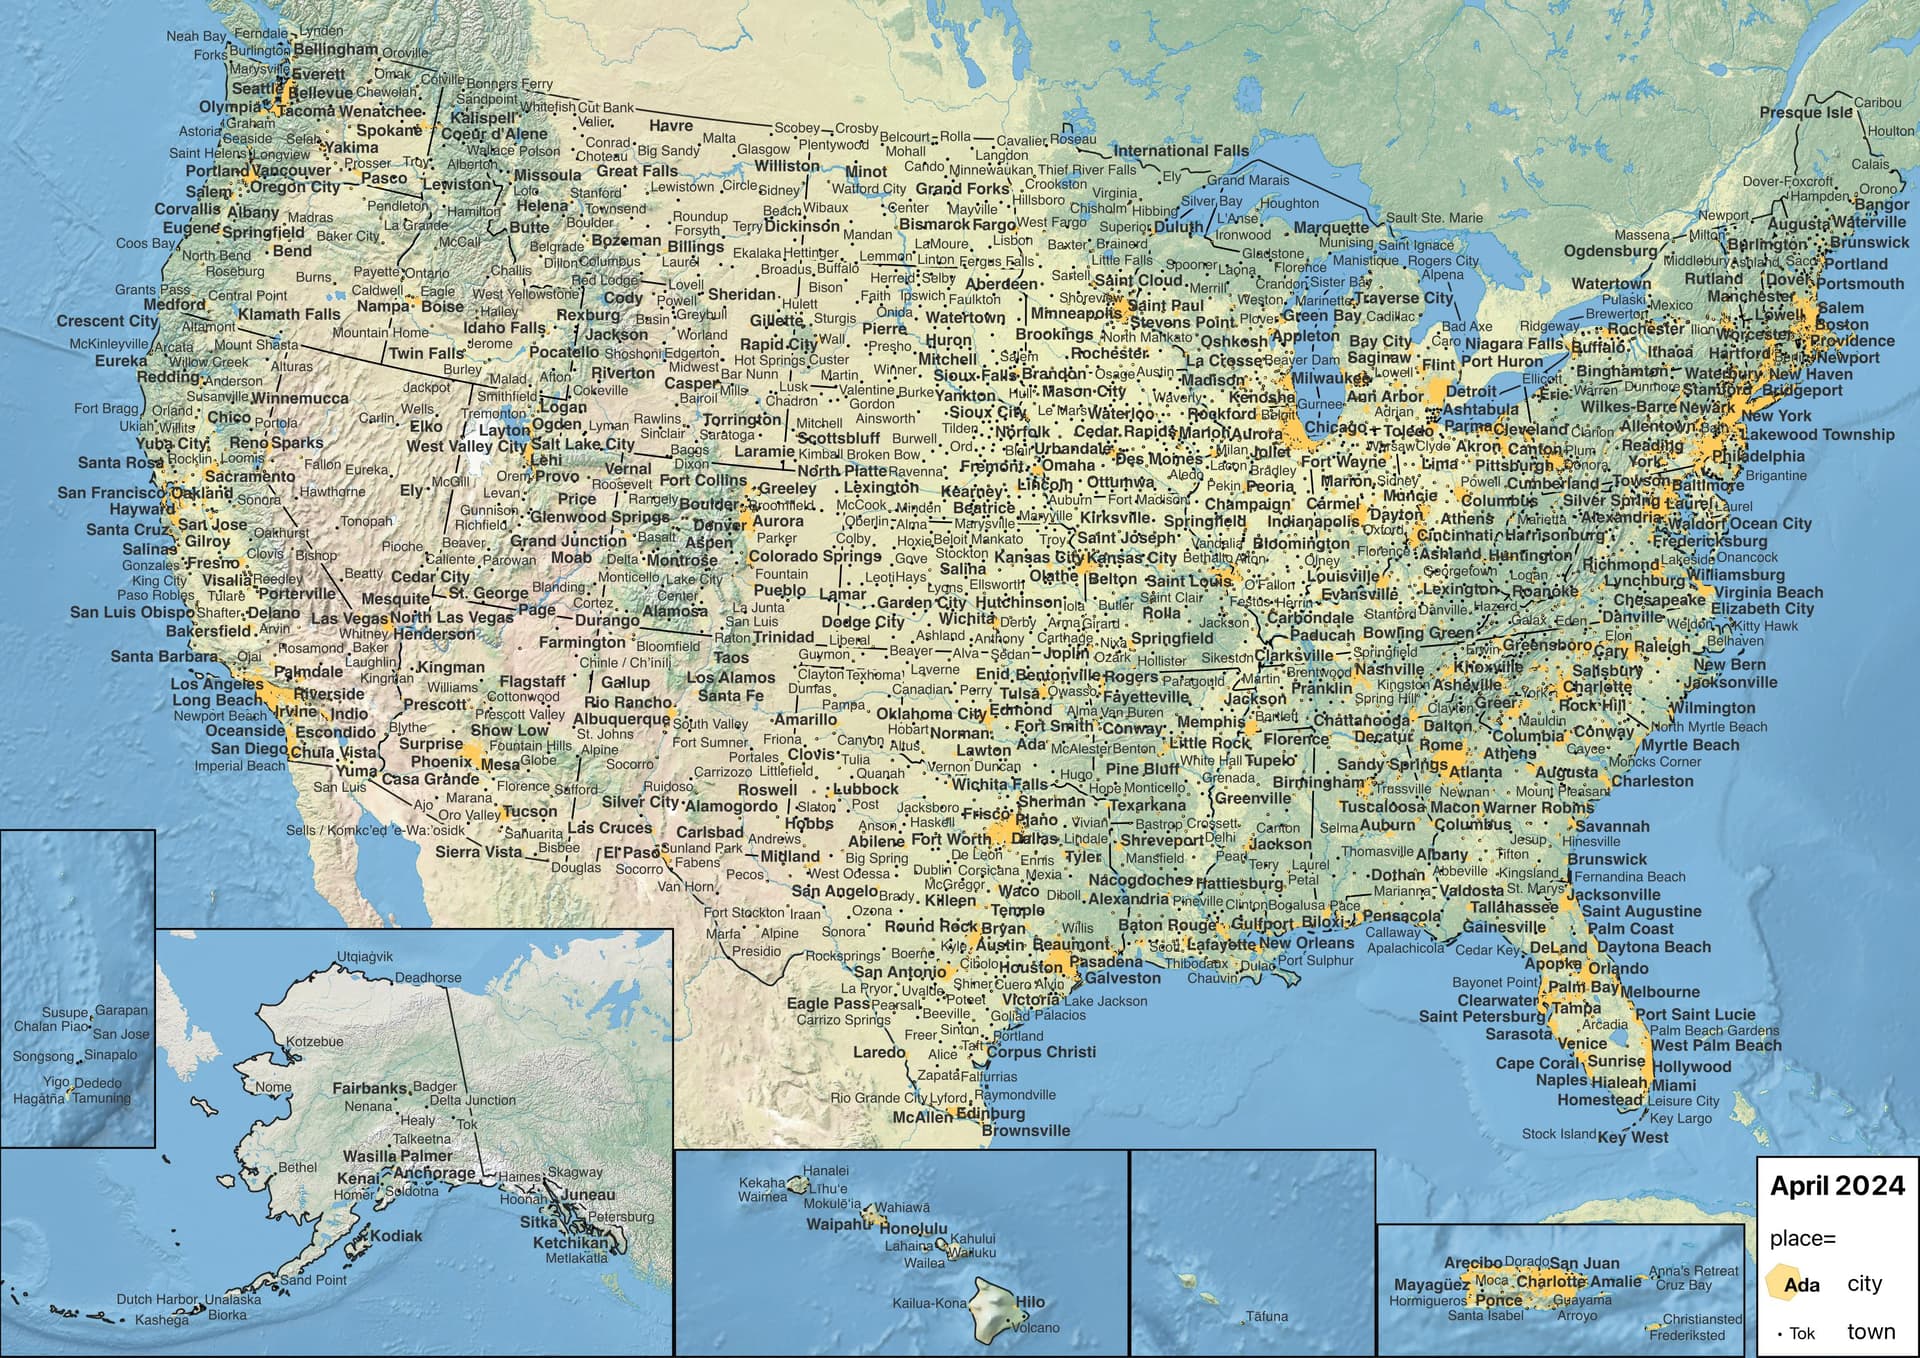
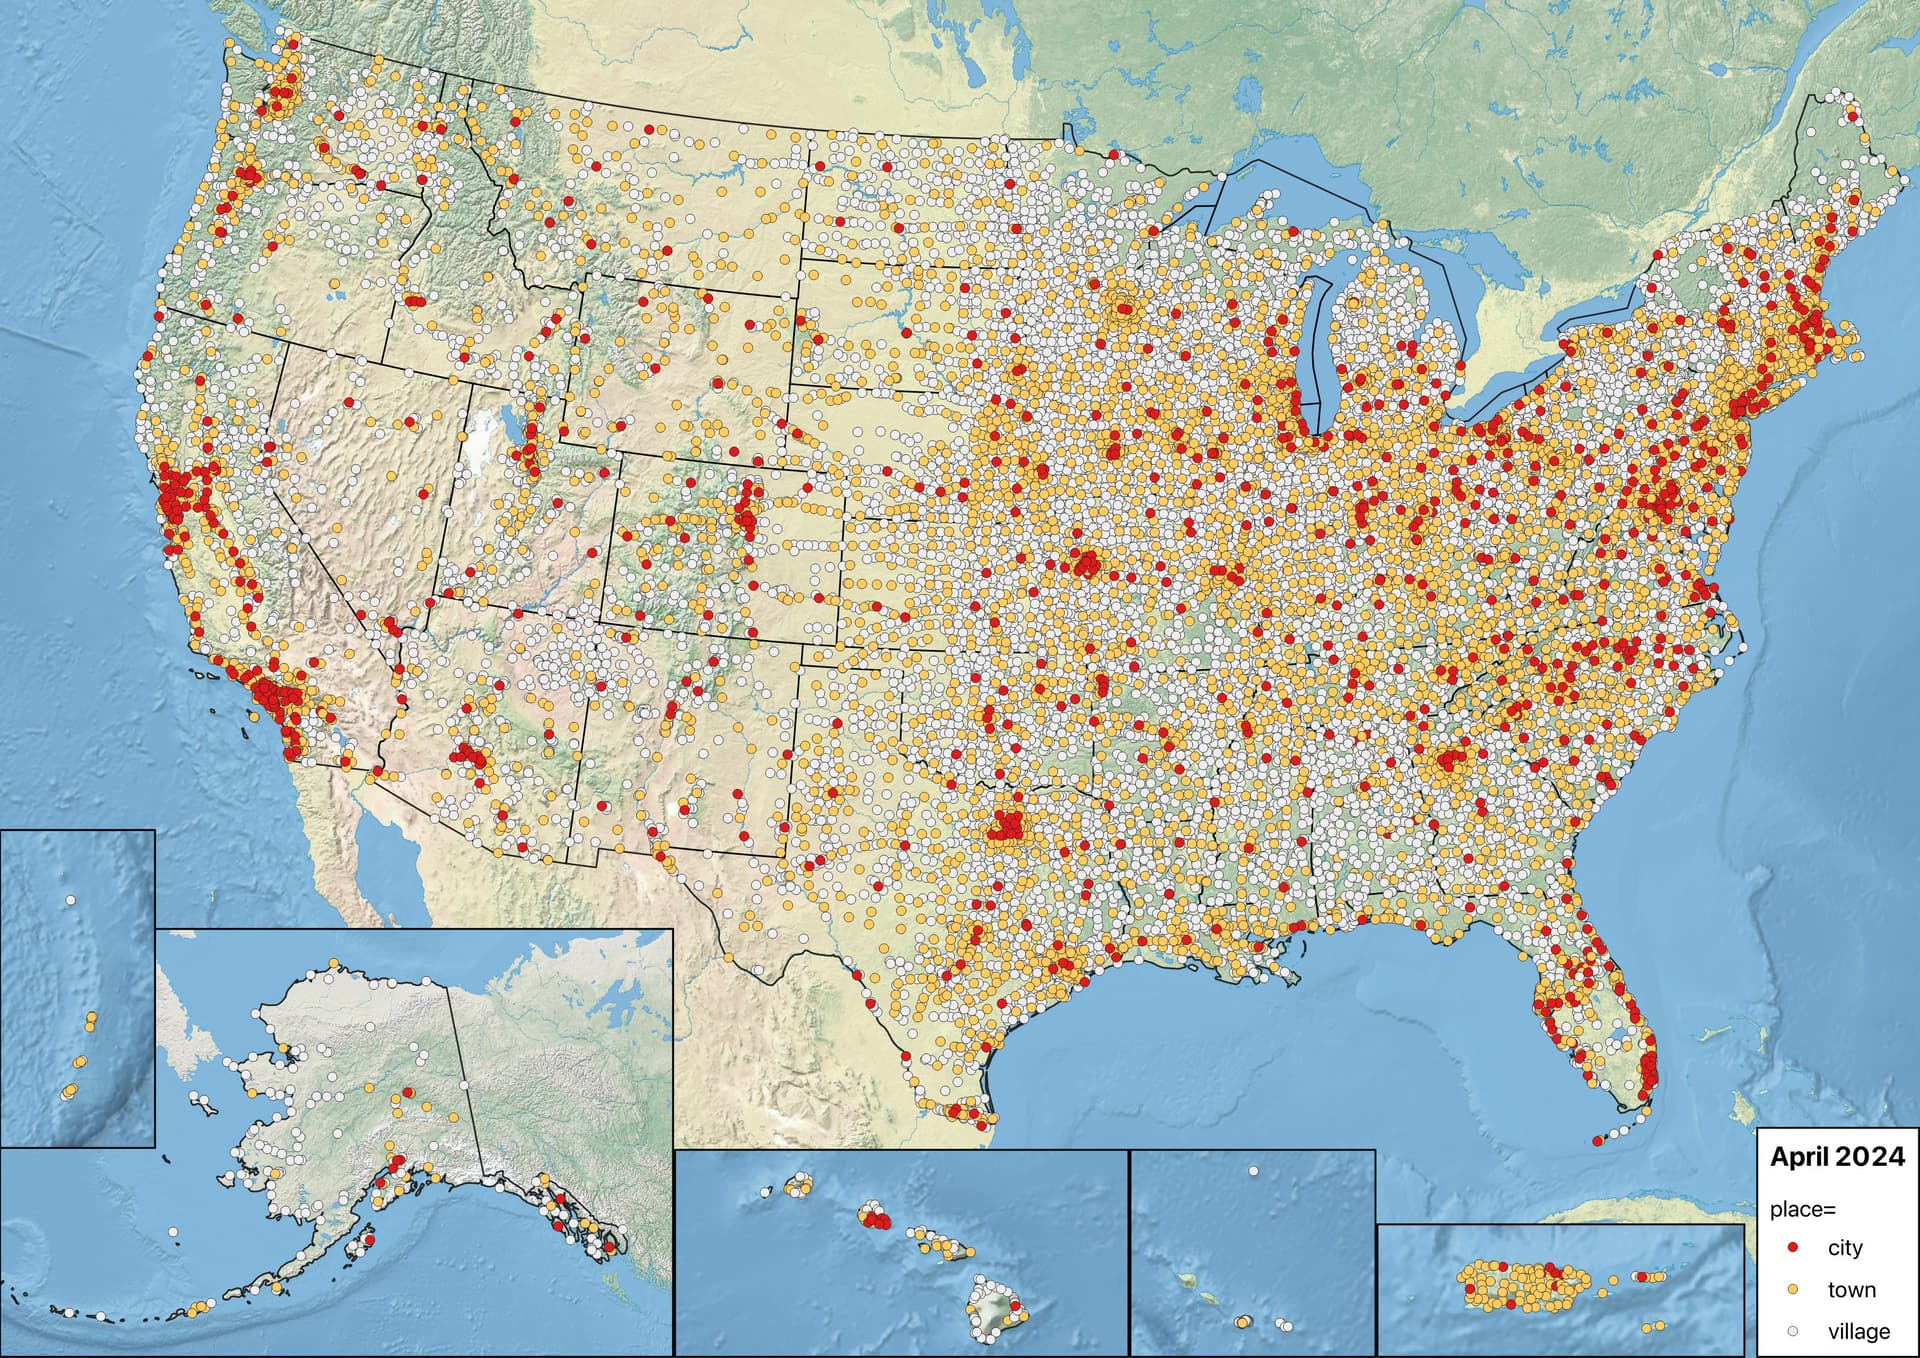
To be sure, this map is quite educational, informing the reader of many places they wouldn’t otherwise know of. There’s nothing wrong with a small-scale map labeling Havre, Montana; Show Low, Arizona; Enid, Oklahoma; Rolla, Missouri; Athens, Ohio; Key West, Florida; or Presque Isle, Maine. Same with populous suburbs like Hayward, California; Olathe, Kansas; West Palm Beach, Florida; and Lakewood Township, New Jersey, if there’s room. But are these place=city nodes so essential for getting one’s bearings that they all definitely deserve a top-tier typographic treatment?
Like the functional values of highway=*, the functional values of place=* should ideally measure connectivity: how well the place binds its surroundings together and leads it in a common identity. We call a suburb a suburb because it lacks that pull, no matter how populous it is. Instead, it’s somehow dependent on a city that has a broader sphere of influence. Meanwhile, a rural town has nothing in its vicinity to pull. How do we quantify this connectivity?
Defining population
As long as place classification is influenced by population at all, then each population figure needs to align with what the place point is supposed to represent, and populations need to be comparable from one place to the next. Our approach thus far has relied heavily on population figures of incorporated places. Though these figures are readily accessible and easy to apply, they misrepresent most cities, taking them out of context unless you’re zoomed in far enough to see each of the suburbs called out separately. Moreover, an incorporated place in one state isn’t directly comparable to an incorporated place in another state, because the two places are subject to very different rules for incorporation and annexation.
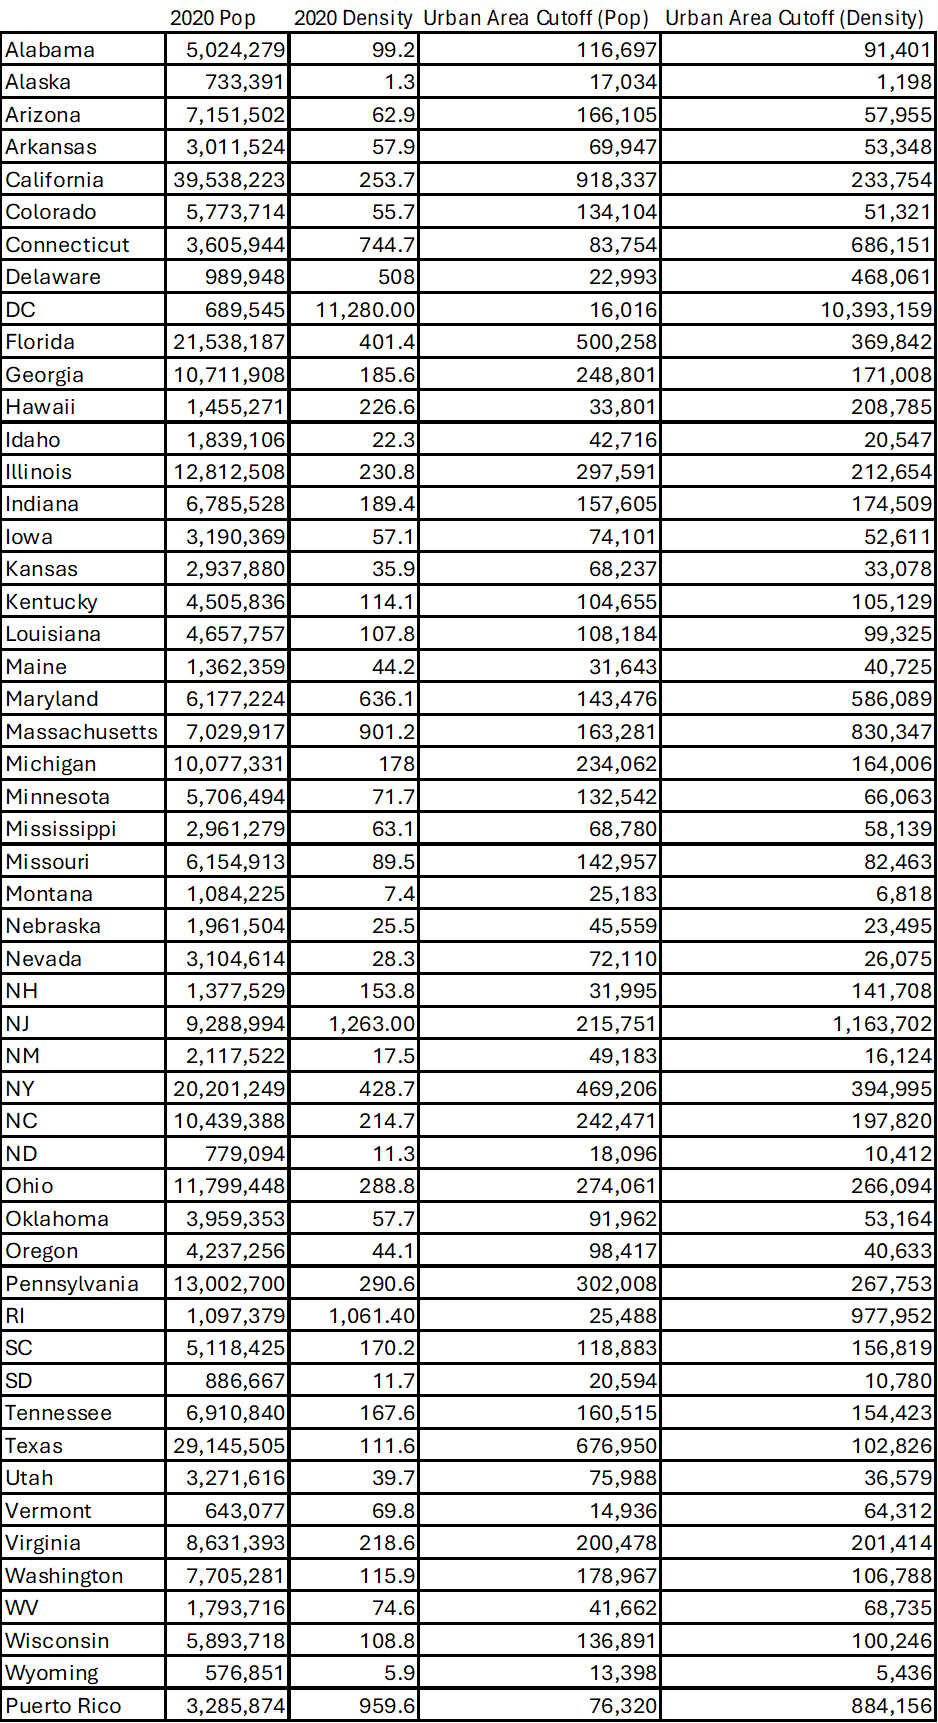
Fortunately, the Census Bureau has calculated a set of 2,644 urban areas that attempt to approximate the coherent built-up area surrounding a place. Each urban area takes into account population, housing, and employment data, plus a dash of history, but almost entirely disregards administrative boundaries.[1] Urban areas are designed to be comparable to each other regardless of the state. The Census Bureau has published papers examining the history of metropolitan and urban classification since the 1910. It’s a good look at the challenges facing the kind of classification we’ve signed up to do.
This interactive visualization based on the 2010 census and a different urban area definition nonetheless does a great job of illustrating the difference between incorporated places, urban areas, and metropolitan statistical areas in terms of area and population:
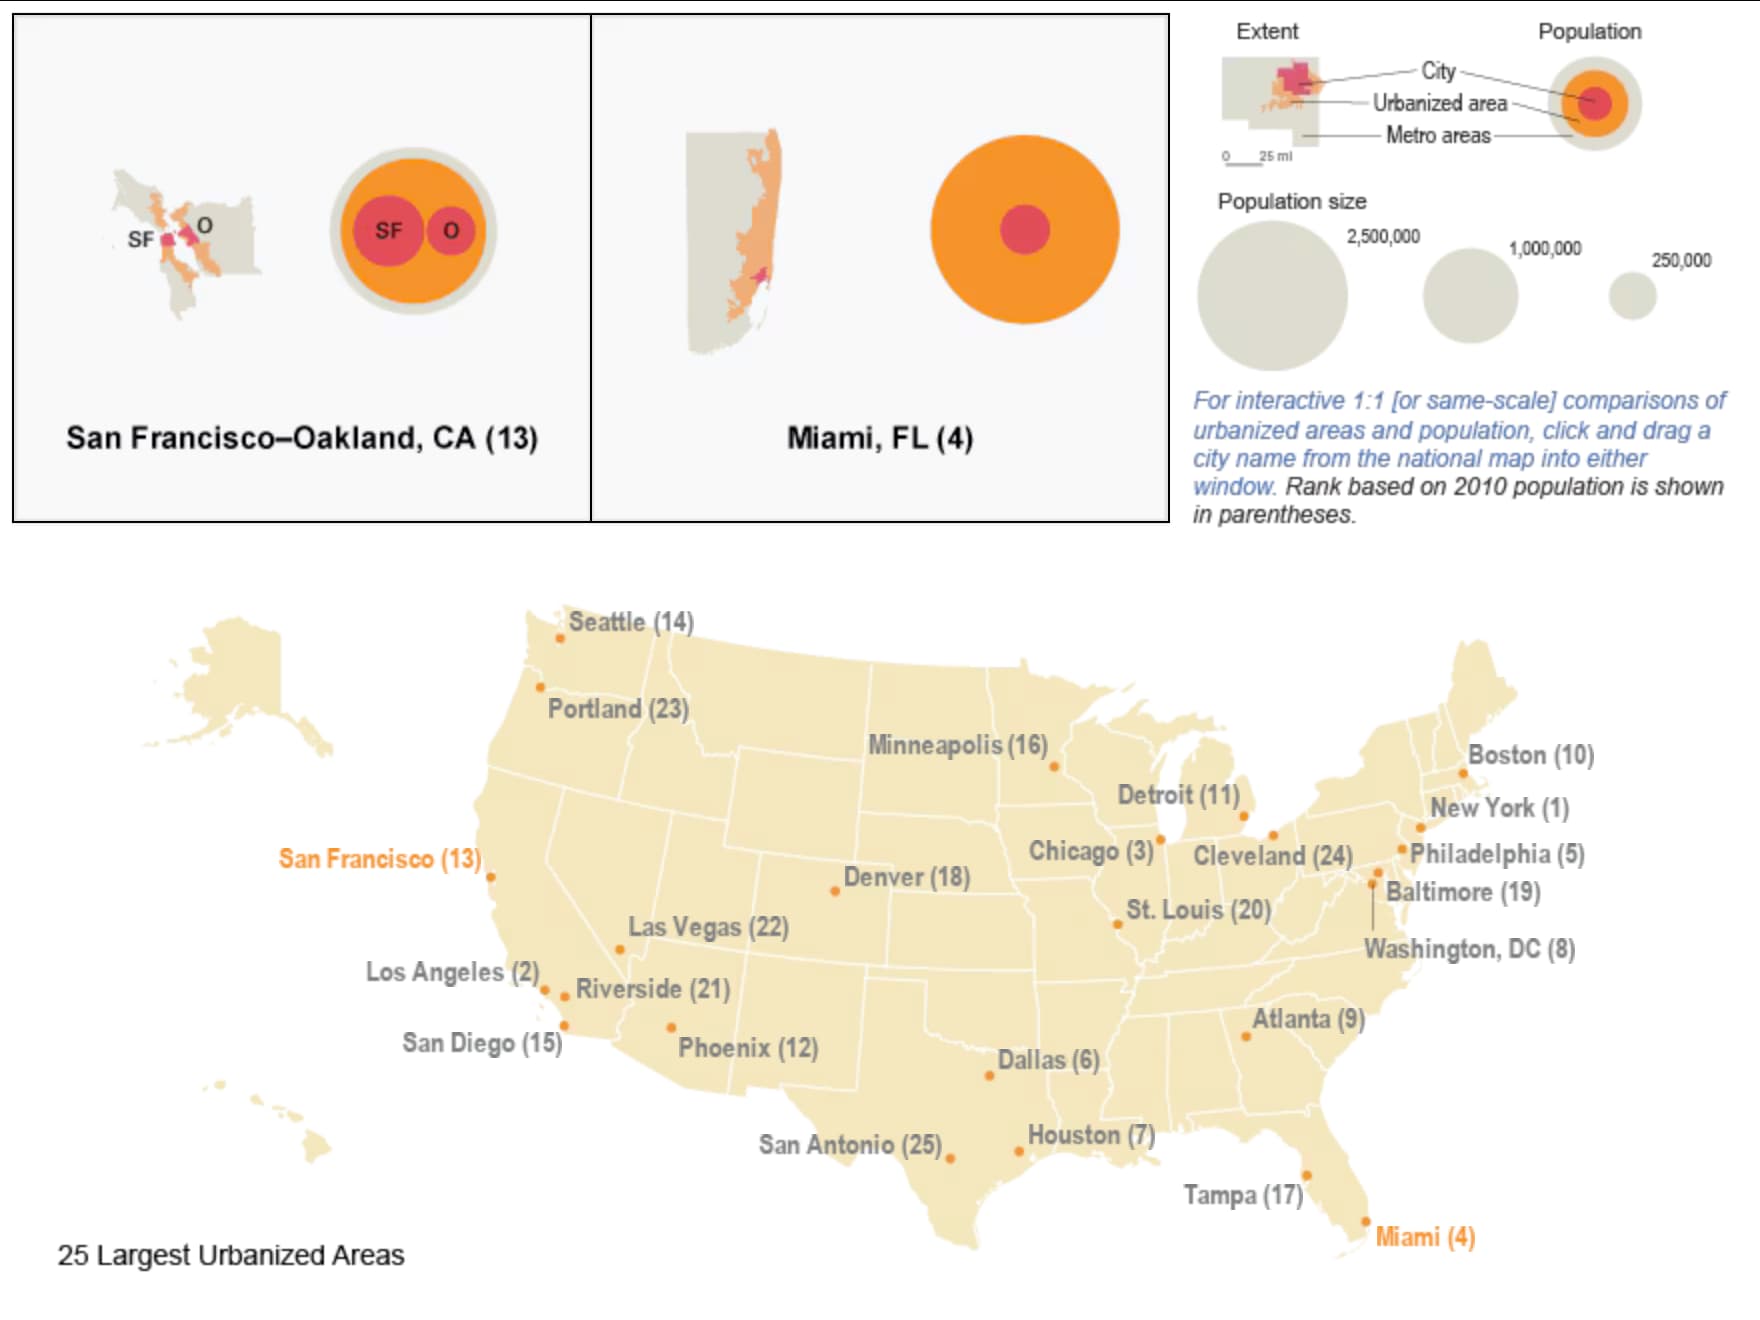
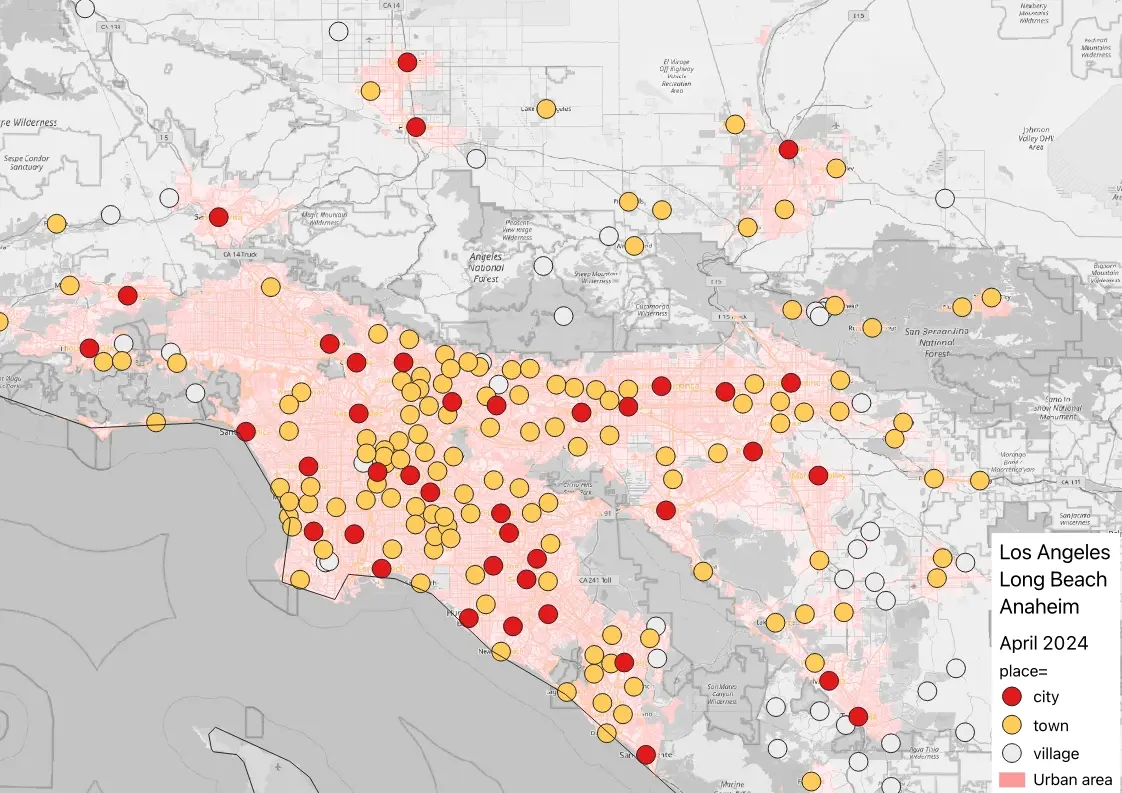
In 2021, @Joseph_E proposed that we tag each urban area’s population directly on one of the places that it’s named after – the principal or secondary places – in order to fix cities that have counterintuitive populations. Though I appreciated the out-of-the-box thinking, I was concerned that redefining population=* proper would lead us down the path to “fuzzy math”. Almost one in ten urban areas has a double- or triple-barreled title, such as Minneapolis–St. Paul and Los Angeles–Long Beach–Anaheim. Would we give all the suburban population to the largest city, even though some of these are close ties, or would we divide the spoils more evenly? Even when an urban area is named after just one place, would we strip all the suburban place=* nodes of their population=* tags, so as not to double-count suburbanites?
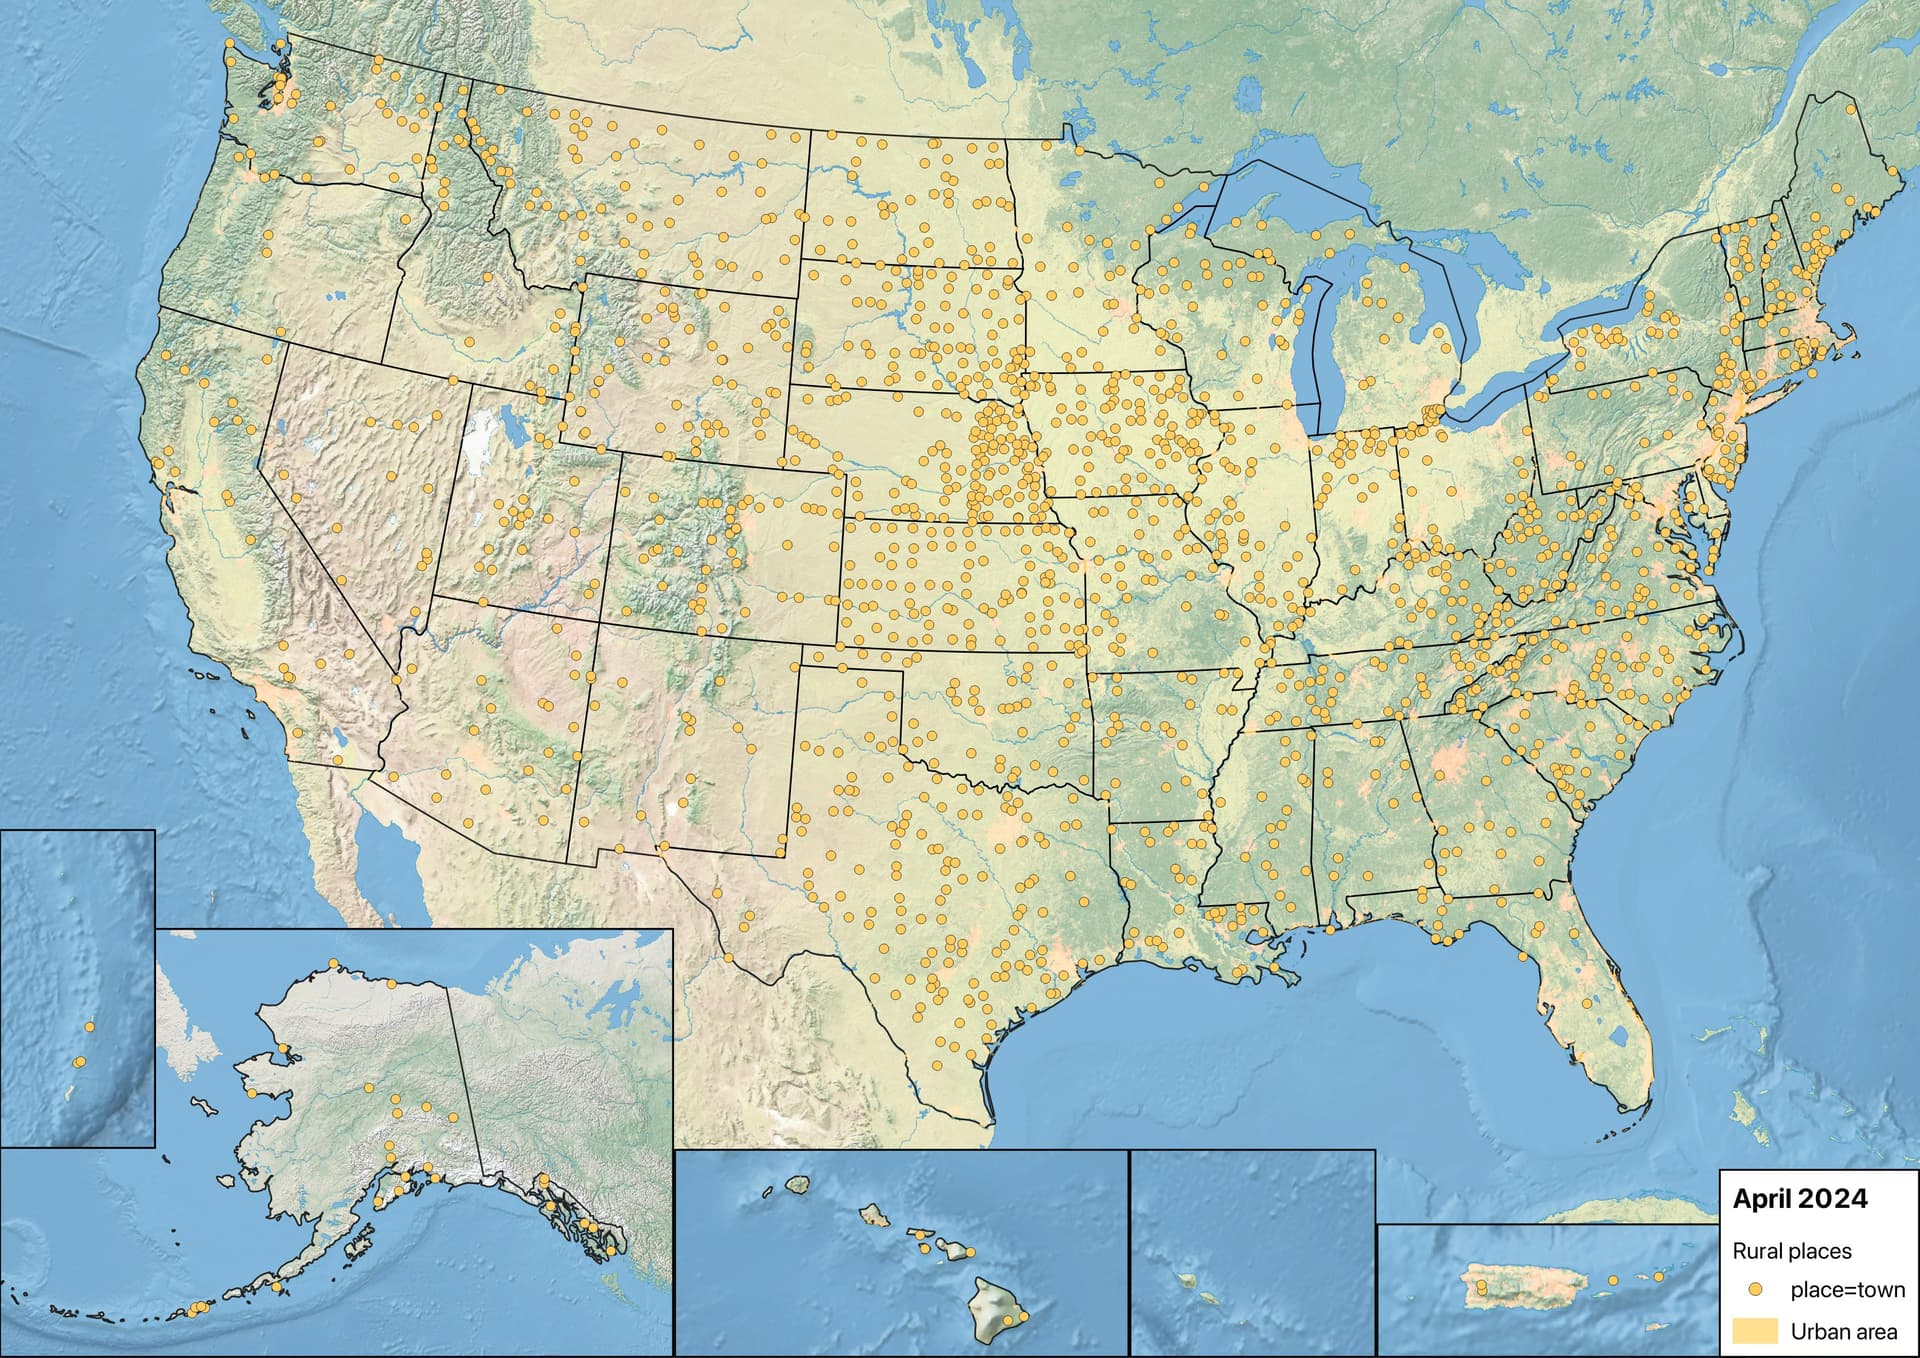
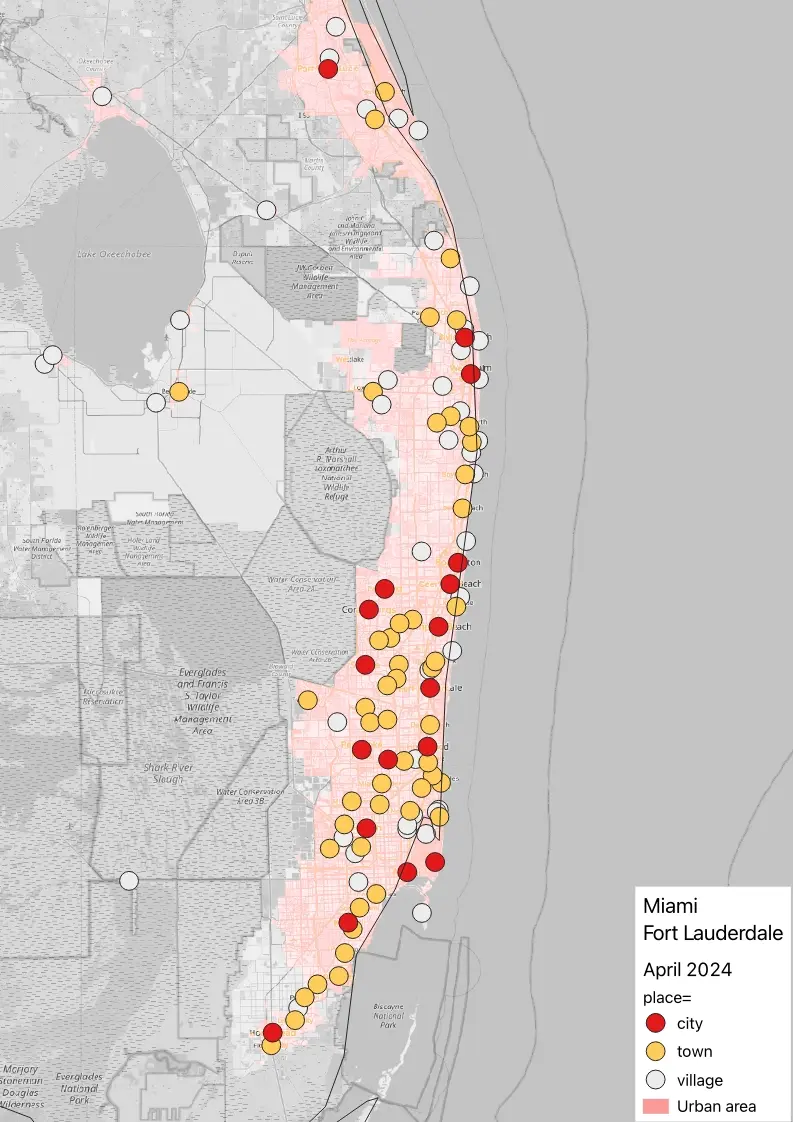
Despite my reservations, I think Joseph was onto something. Urban areas are too nuanced for a quantitative key like population=*, but if we want place=* to be more holistic, urban areas could be a useful check on our classifications, to prevent that “Lake Wobegon” effect. If we restrict place=town and place=city to places in urban areas, we can immediately weed out 1,675 place=town nodes that the federal government considers to be unambiguously rural for a variety of purposes. Maybe we should demote these places to place=village and even less significant places to place=hamlet.
Many of these places were promoted from place=village to place=town despite their populations, because they serve as county seats. But thanks to the quick action of this community over the past couple weeks, data consumers can already give county seats an automatic boost without requiring us to make all these exceptions. If a place’s status as a county seat doesn’t already translate to enough population, housing, or employment to qualify as an urban area, then there isn’t a very strong rationale for promoting it anyways.
On the other hand, if there really is some unusual reason for promoting a place that isn’t apparent in the usual data sources, then this seemingly rigid rule will prompt a discussion, allowing us to distinguish that real-world consideration from an arbitrary one.
Putting suburbia in its place
If limiting place=town to urban areas cleans up rural areas, we still have to contend with inflated classifications in urban areas. In the grand scheme of things, when a suburb is located next to a much larger city, its raw population means a lot less than the population of a standalone town. And when we’re zoomed in far enough to consider only one metropolitan area at a time, any distinction between place=city and place=town wouldn’t be very relevant anyways. Instead, the more relevant distinction would be between the inner city (i.e., place=suburb) and outlying suburbs (place=town).
What if we define place=city by restricting it to the urban area’s titular places, which are designated based on the places’ population and housing unit counts? This heuristic goes a long way toward singling out the places that laypeople would consider to be the urban core. If you were to enumerate the places that meet this new criterion in a state that you’ve never lived in, you’d recognize much more of this list than before. To me, that’s a positive sign, showing that this criterion helps us achieve the goal of classifying based on importance.
How big is big?
Unfortunately, the Census Bureau’s definition of “urban” is very generous, resembling the traditional place=town definition more than any reasonable definition of place=city. Hundreds of communities qualify as urban areas for having more than 2,000 housing units, despite a population below 5,000. Munds Park, Arizona (population 1,096), has its own urban area, the least populous in the country at only 773 inhabitants. This is a typical bedroom community attached to an outdoor recreation destination, almost exclusively residential, with a skyline that bears little resemblance to the sort of place typically documented as place=town, let alone city.
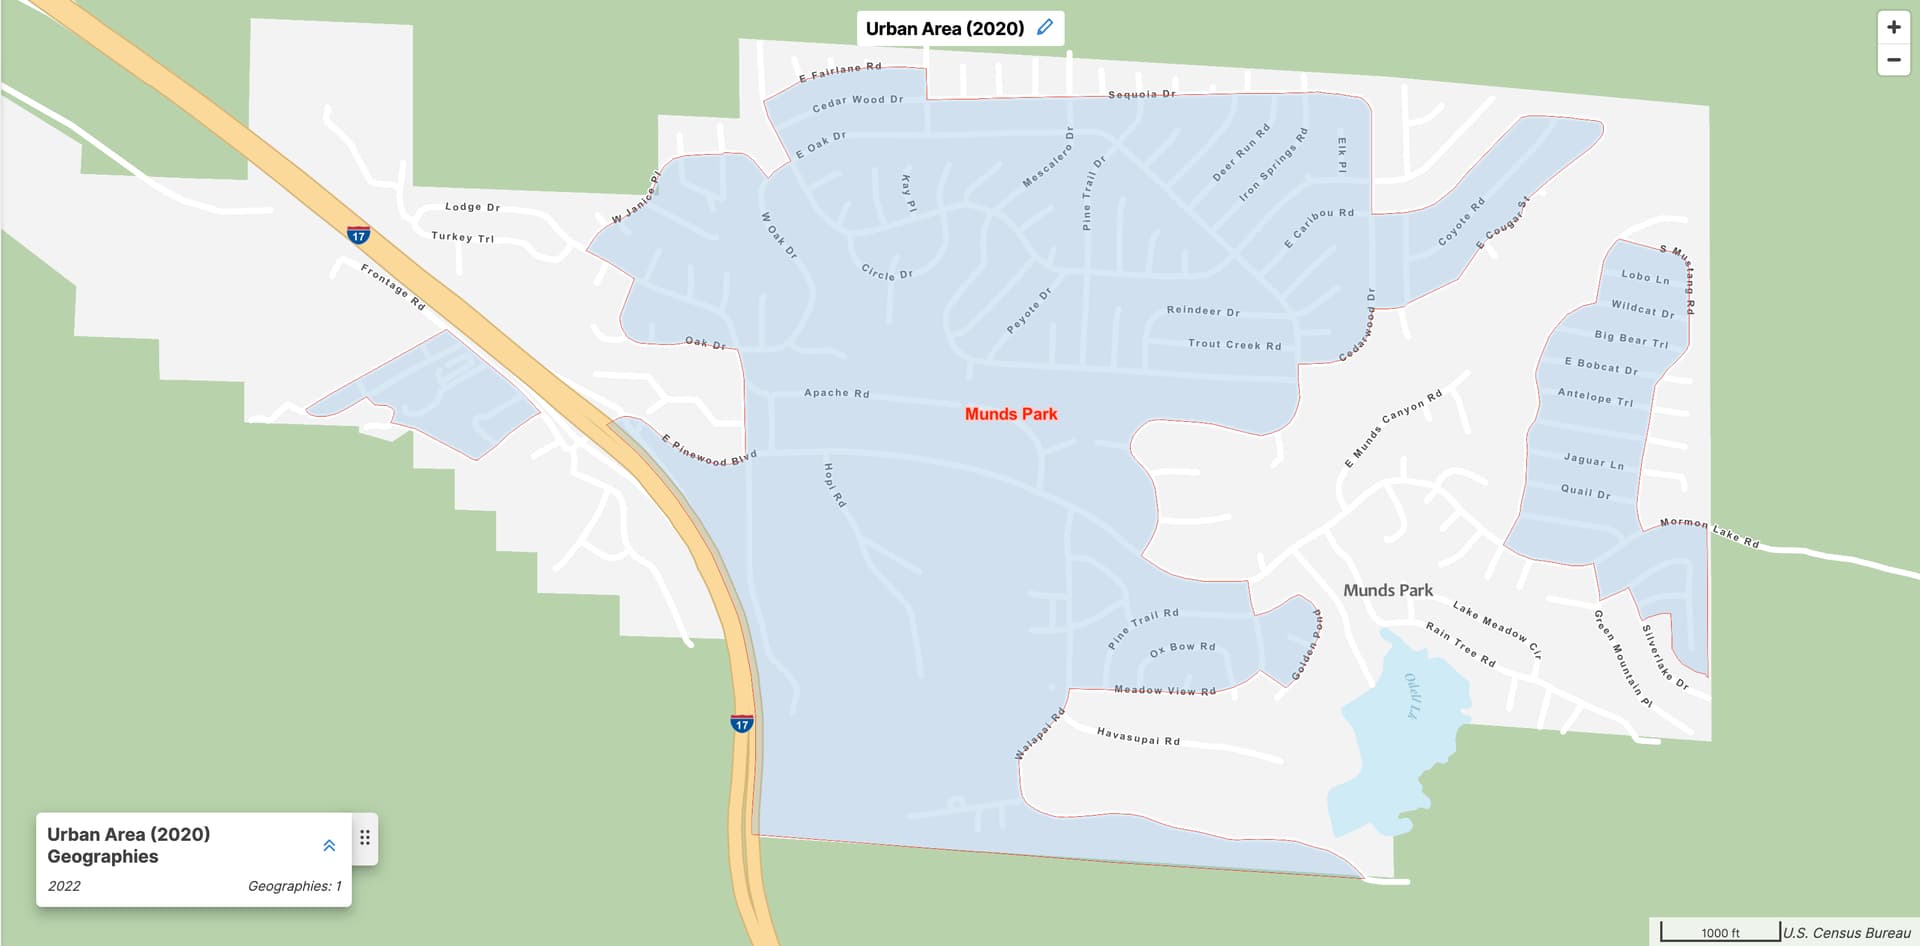

At this point, it’s worth remembering that a place’s remoteness doesn’t inherently cause it to become more important. Despite its isolation, Munds Park is still a bedroom community dependent on Flagstaff for big-city services. On a rendered map, Munds Park may still appear in order to fill in some empty space. Or on a map that prioritizes natural features and deemphasizes populated places, it may not appear at all.
Clearly, urban area titles alone are inadequate for defining place=city. Unless we distinguish Munds Park and hundreds of communities like it from big cities, deemphasizing suburbs would lead to a bizarre imbalance between rural and urban America. We need some other criterion for distinguishing between a major urban area and a minor one.
Obviously, a big city is more populous than a small town, but beyond that, there are other factors that determine whether a place functions more like a big city or more like a small town. Unfortunately, this determination has defied a quantitative definition, Dairy Queen and Whataburger notwithstanding. It seems like all roads eventually lead back to population, even after acknowledging other nuances.
Two official sizes of urban areas
In the 2000 and 2010 censuses, the Census Bureau did make a distinction between larger urbanized areas and smaller urban clusters, but it was essentially an accident of history. When the concept of an urbanized area was first introduced in 1950, the Census Bureau was operating under a tight deadline while relying on paper maps, so they opted to only compute urbanized areas based on incorporated places with 50,000 inhabitants or more. They just picked a nice round number as any project manager would. Later censuses kept that threshold because population figures need stable definitions to be compared across years. By 2000, the bureau had adopted more efficient computerized methods, so they introduced urban clusters as a supplement. In 2020, they unified the two concepts into a single urban area definition.
As an experiment to see if a population threshold would even help, I arbitrarily set the threshold for a major urban area at 101,536 inhabitants, which is the median population of a 2020 urban area. To avoid overweighting the inhabitants of twin cities, I divided the urban area’s population by the number of places in its title before comparing it to the threshold. I also put place classifications on a sliding scale based on the urban area classification:
| Environment | Principal place | Secondary place | Other place |
|---|---|---|---|
| Major urban area | city |
city |
town |
| Minor urban area | town |
town |
village |
| Rural area | — | — | village |
Indeed, for the most part, the nominally urban areas get downgraded, and we’re left with a less unwieldy city layer:
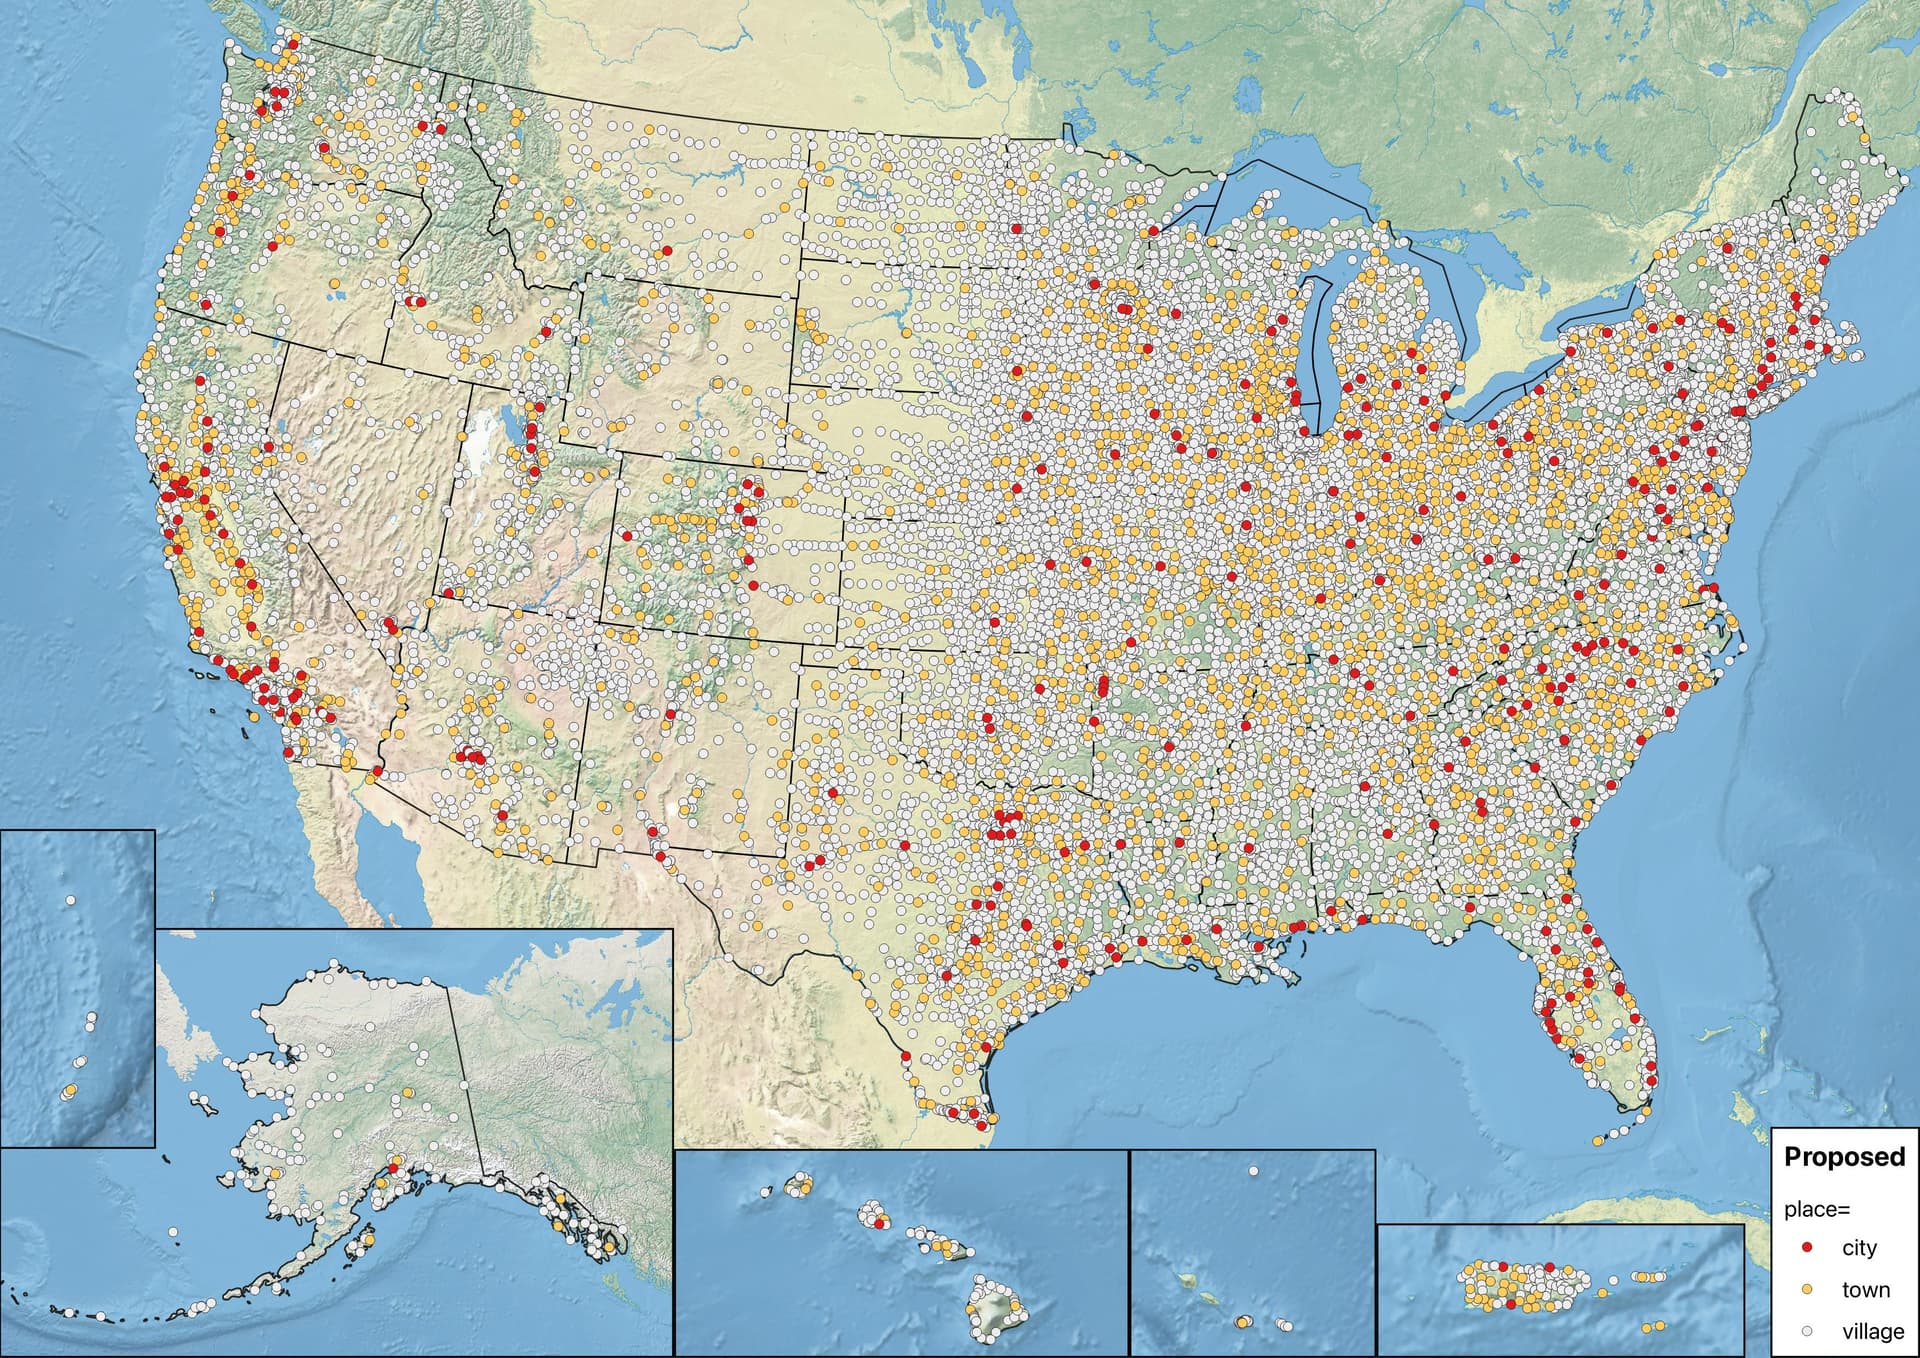
Unsurprisingly, this distinction results in far fewer place=city across the board. Rural states like Montana and Alaska are left with even fewer cities than they had before. Wyoming and the U.S. Virgin Islands have no city at all. Fortunately, enough place=town also get demoted to place=village that you can still look at a map of dots and reckon which town is Bismarck or Casper, something you couldn’t easily do if the only change we make is to restrict town to urban areas. Meanwhile, populous states like California and Florida have lost many of their cities too, with a similarly enhanced discernibility.
Rules are made to be broken
Sometimes, urban areas are more granular than what locals consider to be a coherent metropolitan area. For example, laypeople regard the San Francisco Bay Area as a single metropolitan area anchored by San Jose, San Francisco, and Oakland. But the OMB’s combined statistical areas are too coarse for this cultural region, while metropolitan statistical areas are too granular, to say nothing of the Census Bureau’s urban areas. Like many California cities, Concord and Walnut Creek are very populous by national standards, but locals would probably consider them to be suburbs in the Bay Area, if not specifically of Oakland.
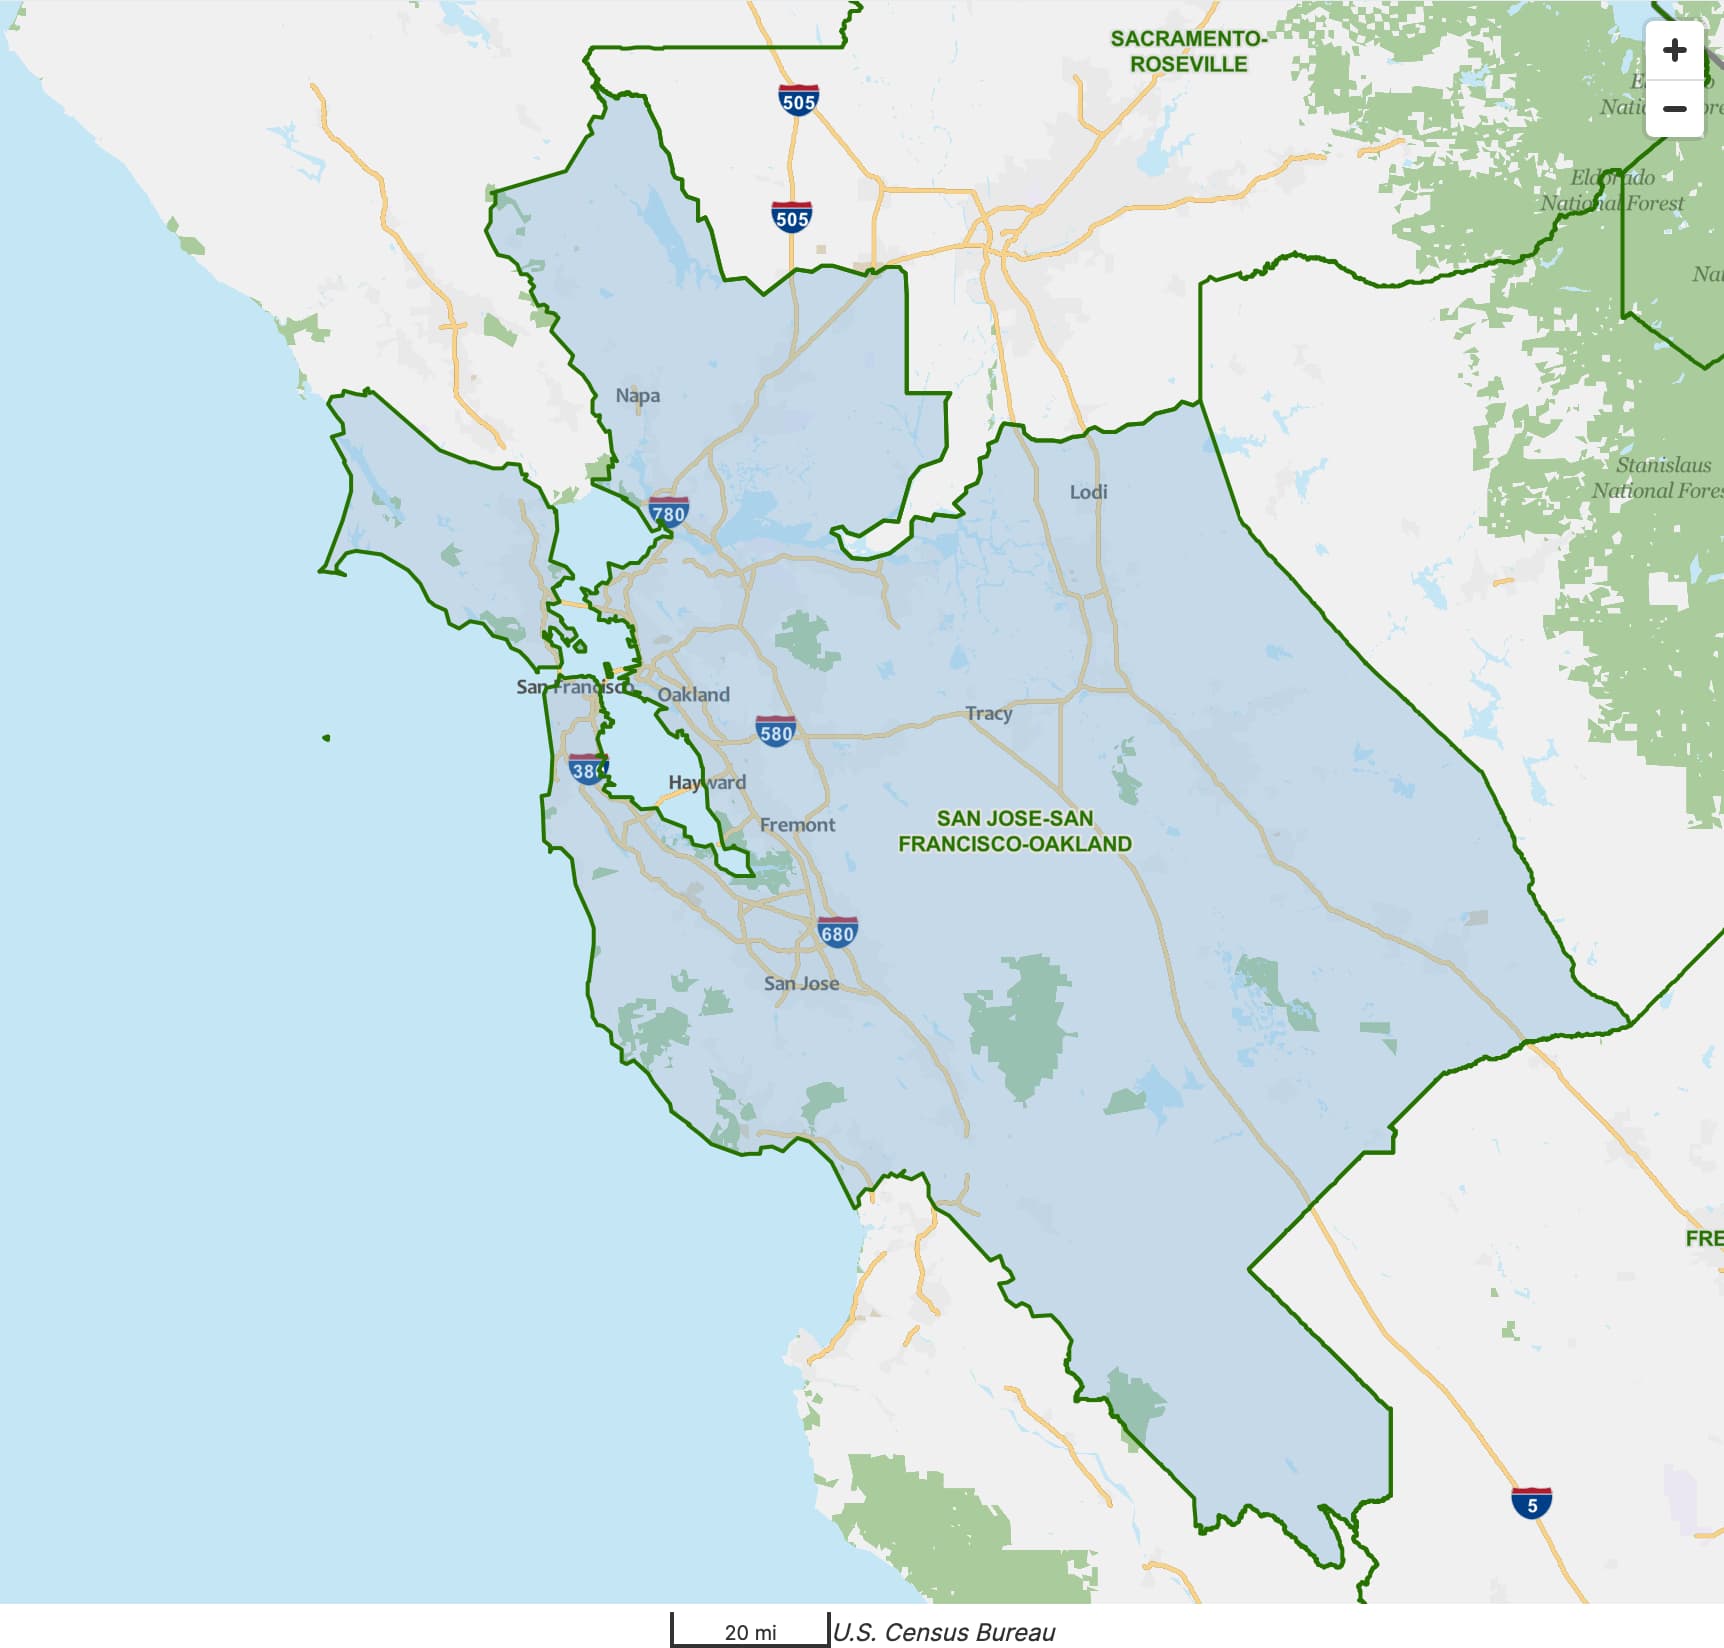
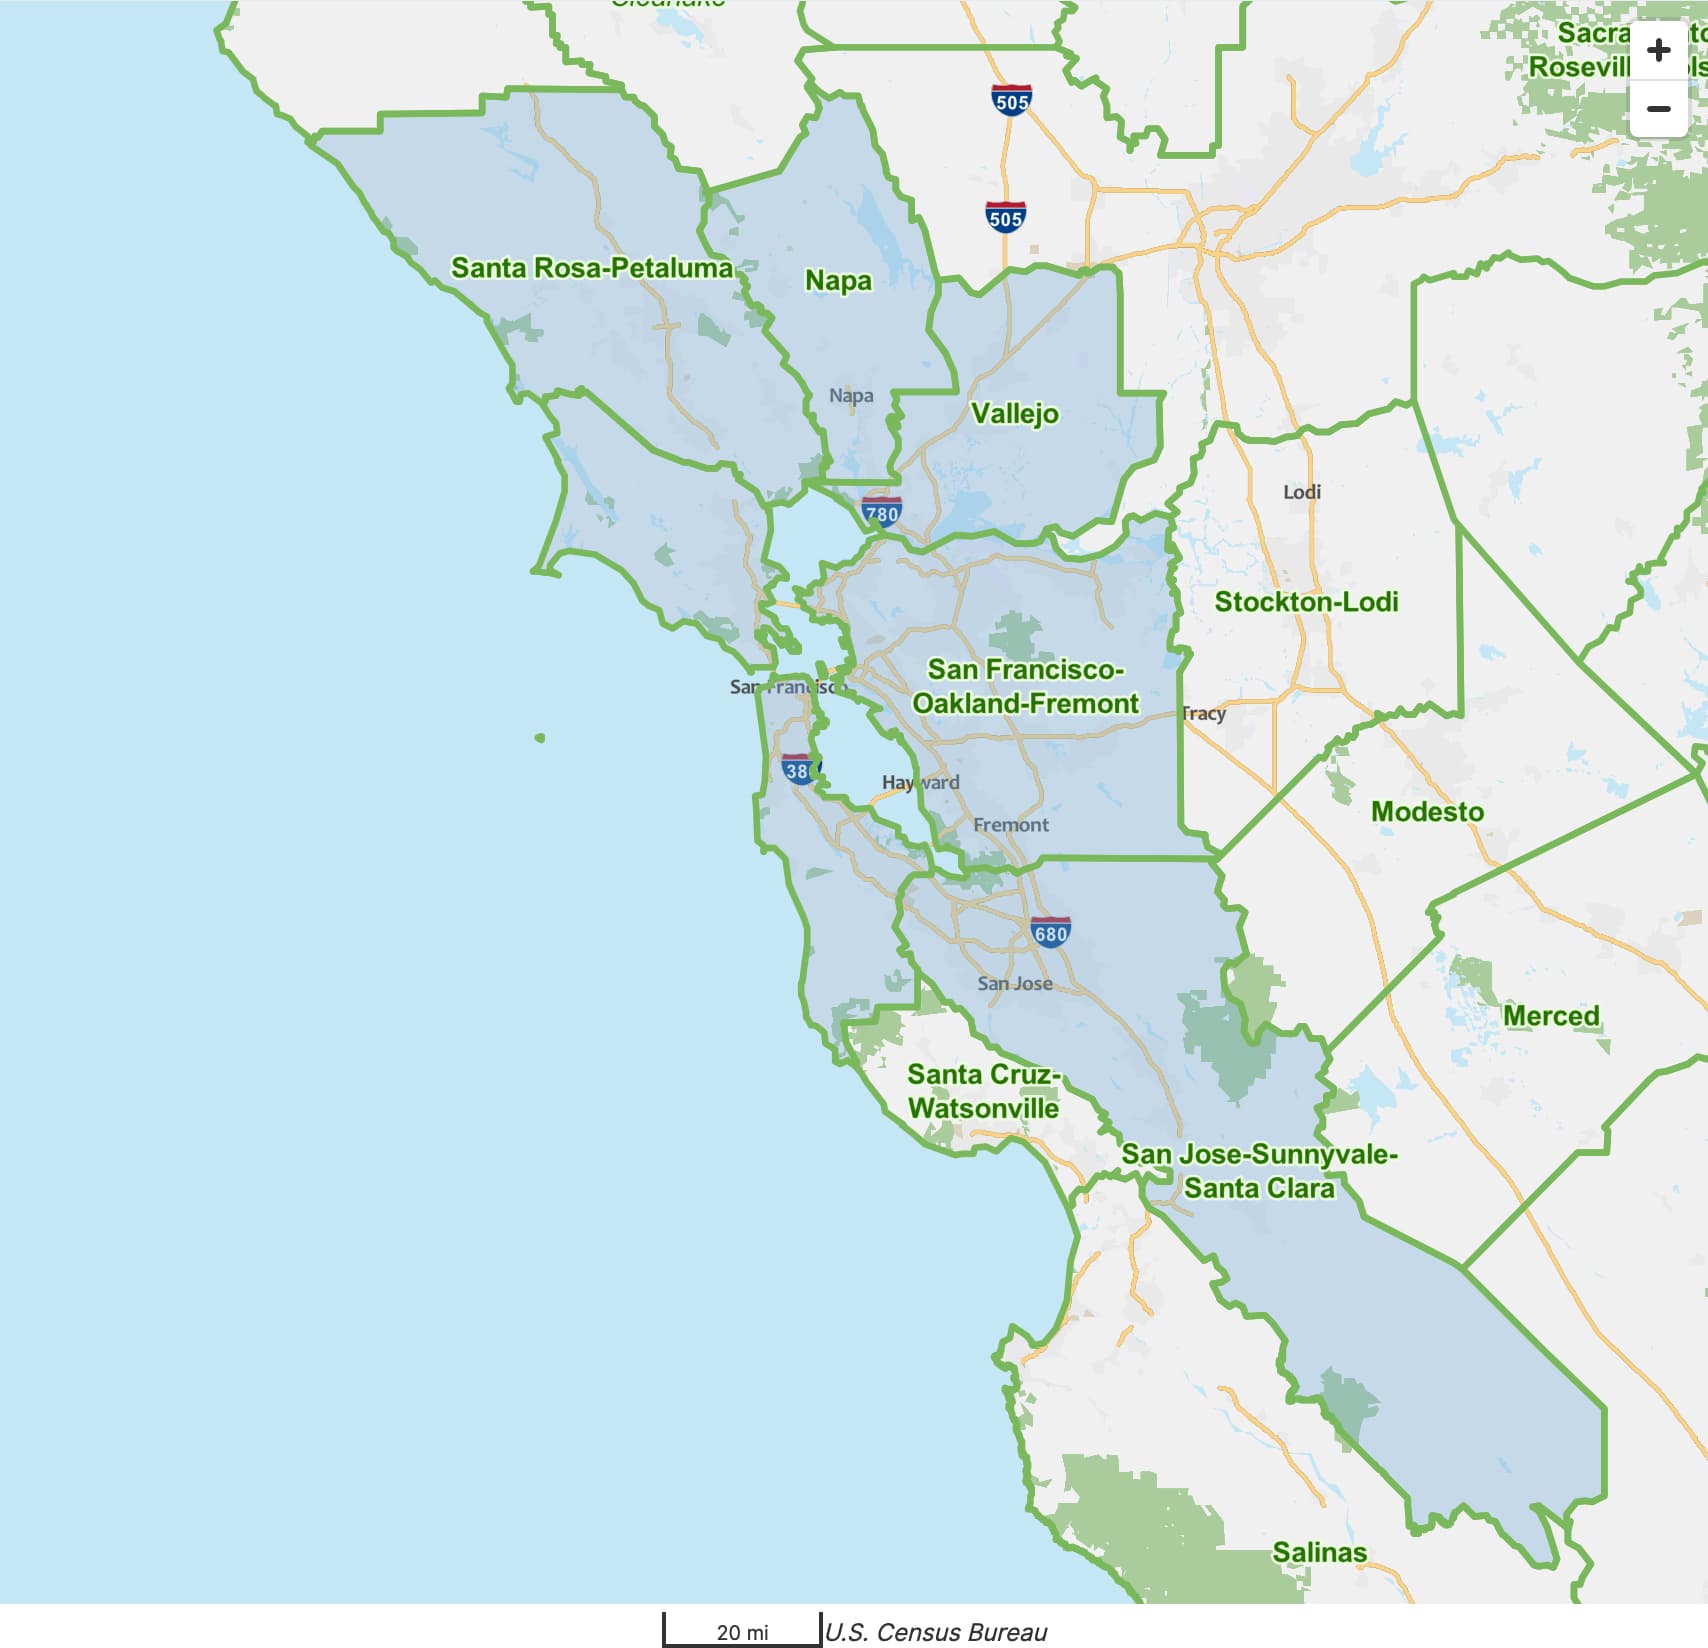
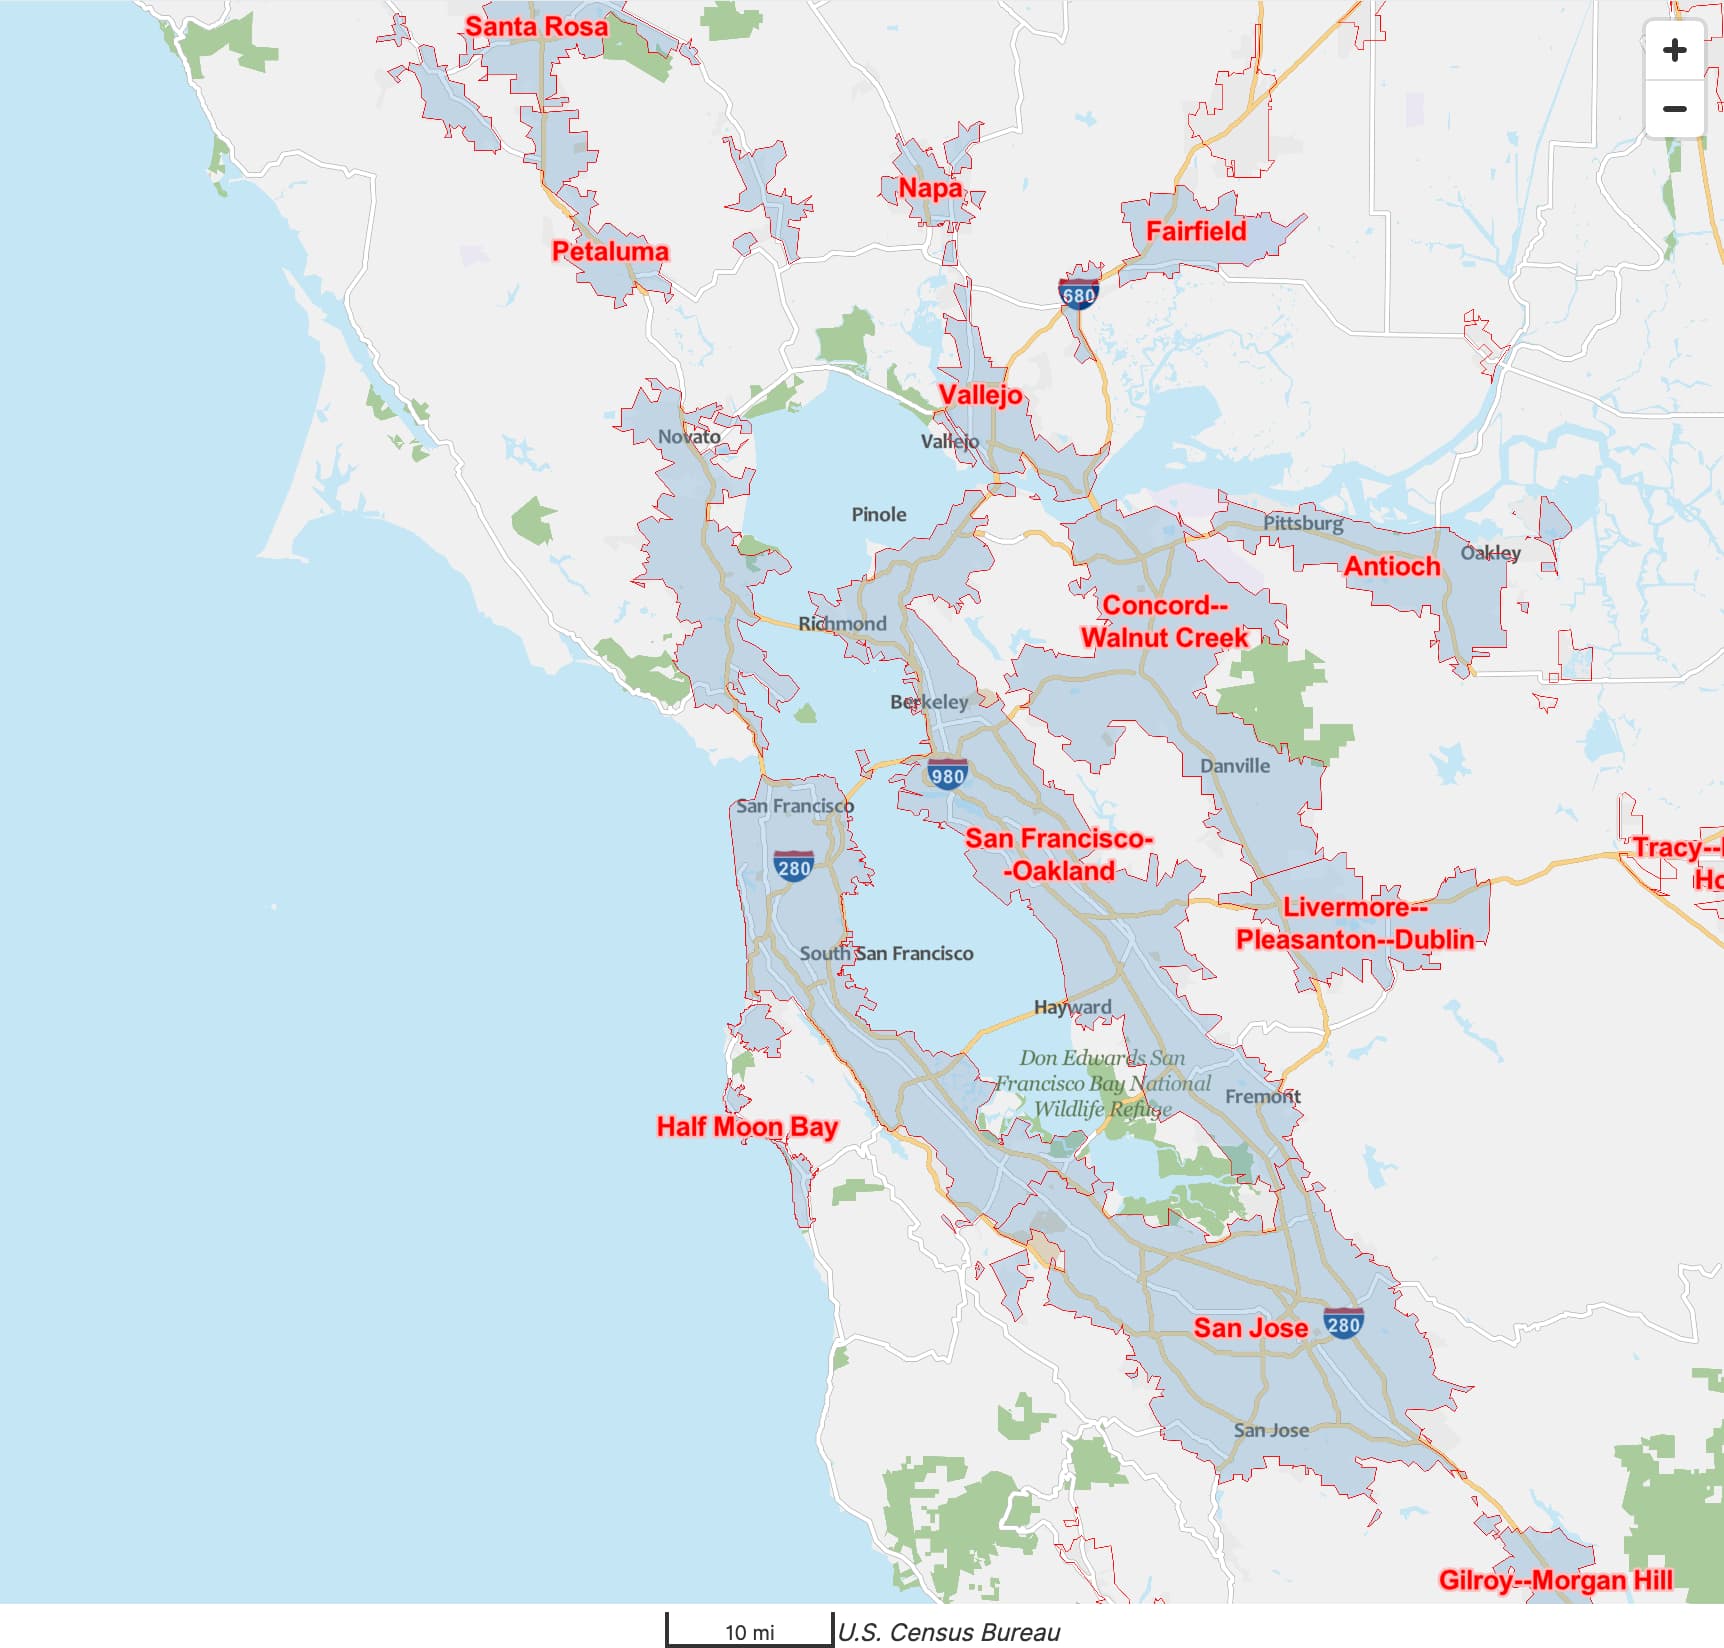
It’s entirely possible that, at some stage in the Census Bureau’s process for calculating the San Francisco–Oakland urban area, it actually included Concord–Walnut Creek, but then it got split out for the same reason that San Jose remains separate: the process somewhat respects historical distinctions between urban areas that used to be separated by a greater distance and used to have weaker economic ties before they merged together.
I think cases like this are rare enough that the overall approach would still be a marked improvement over the status quo. There’s nothing sacrosanct about the number 101,536, but any purely population-based heuristic is a balancing act between decluttering rural regions and decluttering populous regions. We’d have to increase the threshold to a whopping 269,292 to make Concord–Walnut Creek a minor urban area and equate its two titular places with Oakland’s other suburbs. However, that would probably rob several more rural states of their last place=city. Alternatively, we could try setting additional constraints based on population density, housing density, or proximity.
Or… we could make an exception. You’re probably snickering at this point, but my goal isn’t to completely eliminate exceptions. Rather, I want us to establish a better general rule that satisfactorily classifies the vast majority of places, minimizing the number of exceptions. I want us to limit the exceptions to cases that are more self-explanatory than the Show Lows and Presque Isles we have today.
Just the beginning
As mappers, we aren’t accustomed to applying tags that depend on countless other tags hundreds of miles away. We specialize in zooming way in, mapping from the lowest possible vantage point, applying the most hyperlocal knowledge we have. For years, we used to document tags like highway=trunk and highway=primary using a set of ostensibly representative street-level photos, before we realized that such photos misleadingly prioritize construction quality over function and connectivity. Our preconceptions of what counts as a big city are shaped by our own life experiences. Within the U.S. community, I’d guess that relatively few of us have lived in different regions and experienced both urban and rural America. Those of us who have still carry our own biases that aren’t necessarily relevant to a map user.
Whatever further adjustments we try, I think we should try to start from first principles and the wealth of statistical data we’re lucky enough to have available in the public domain and see where the chips fall. It would be tempting to do the reverse, to decide how we want each chip to fall and work backwards from there. But we’ve already seen how difficult it is to reach consensus among mappers with diverse perspectives. An overfitted heuristic without a foundation won’t stand up to scrutiny, or dissent.
If nothing else, hopefully I’ve inspired folks to think outside the box about statistical data. In the colophon that follows, you’ll notice that the maps marked “Proposed” barely make use of OSM’s existing place=* tags. Even if nothing ever comes of this exploration, I’ve outlined an algorithm that data consumers could substitute for OSM’s place classifications, with enough effort. It just wouldn’t benefit from the well-considered exceptions we’d make to such an algorithm.
If two urban areas have grown so that they’ve collided into each other, the boundary between them may follow city limits. ↩︎