it’s getting old already… I think the only time I was actually reported for deleting something was this one time in Romania, which I described.
And you don’t have any info or context about other deletions which I did, whether I was remapping something, already talking with the author about changes or else. So basically stop imagining things while trying to paint me in bad picture. “clear statement” for real…
But overall, I’m happy that the thread sparked quite some discussion here! ![]()
Your deletions from 3 days ago are rather recent. The bad ratings and comments from others on the CS and on this post are self explanatory, they were justified. Anyway…
Yeah overall, thanks for the discussion you all ![]() and @dpolovinkin for reverting your deletions. It’s not worth staying in conflict and admittedly you came here by yourself, yet I don’t understand why you created this post since we had a discussion 6 months ago where i took the time to explain you (calmly IMO) everything what people here said and with examples. Different opinions are natural but subjective interpretations of needs in a shared open project is irrelevant.
and @dpolovinkin for reverting your deletions. It’s not worth staying in conflict and admittedly you came here by yourself, yet I don’t understand why you created this post since we had a discussion 6 months ago where i took the time to explain you (calmly IMO) everything what people here said and with examples. Different opinions are natural but subjective interpretations of needs in a shared open project is irrelevant.
I’ve walked there (the Red Rock example) and they aren’t helpful.
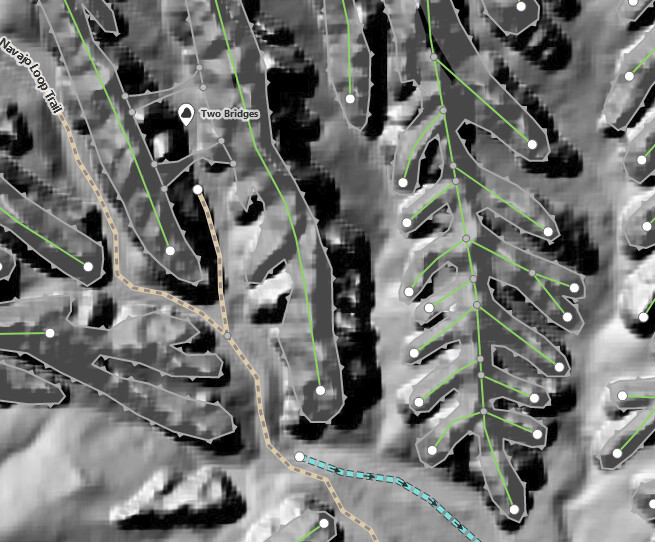
But they’re also incorrectly mapped from satellite imagery. Some of those lines are cliffs and others are not, so it might be different from other cases: Many rock features drawn as `natural=cliff` but not correctly
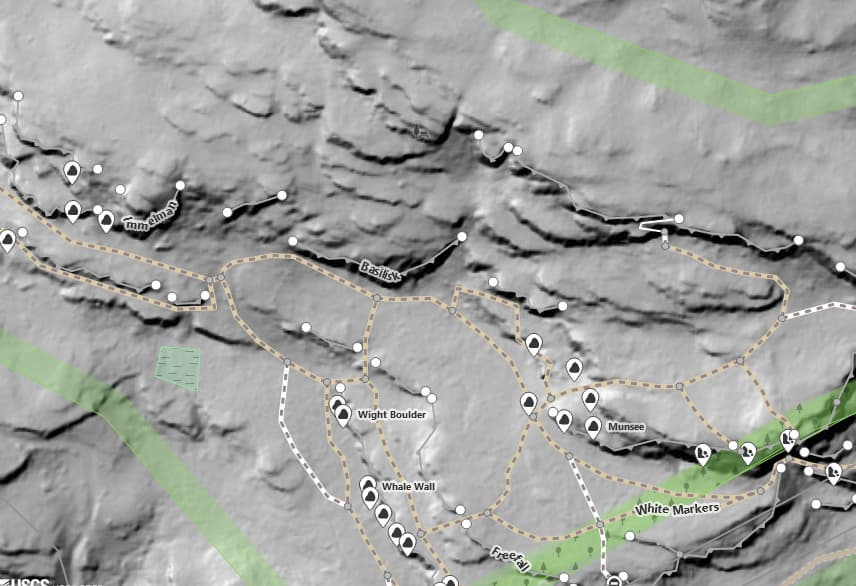
It also clutters the map so much that it’s more difficult to see the notable climbing cliffs that I’m aiming for. Using LIDAR hillshade imagery for the background image, with OSM notable cliffs overlaid on top is much more useful, like this:
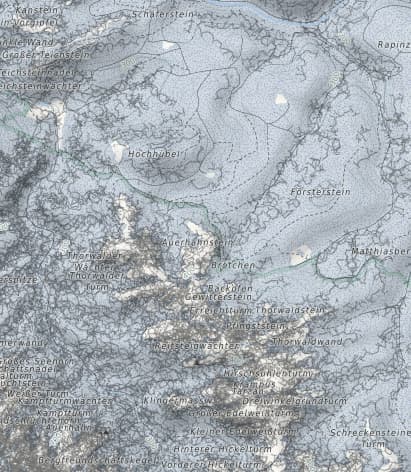
I’m not sure if the other two examples are really cliffs, either:
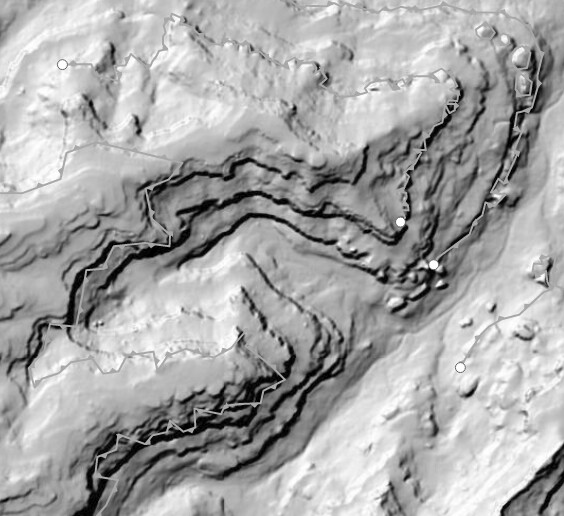
I’m not opposed to mapping all cliffs, I guess, but they have to actually be cliffs. If they’re all connected into a continuous polyline, it’s unlikely that they’re actual cliffs.
3 Likes
Replying to the OP: Mapping like this adds nothing of value. It merely duplicates what the source LIDAR data already states in a more convenient way.
3 Likes
You are questioning the entire OSM.
Mapping roads does not add any value either. It merely duplicates what thousands of other maps already show.
2 Likes
We should change name to OpenTopoMap. Put contour lines in already!
BTW, can somebody point out where on how to make map files (for Osmand etc) but with all extraneous details like this filtered out?
There is (as always), a few rhetorical responses on this thread, so I thought it was worth a shot trying to render cliffs in a way that does not clutter the map in those micro-mapped areas.
Because there’s no way to actually differentiate a natural=cliff from one another, on Opensnowmap style (just locally, this is not live) I tried to make a fainter rendering on cliffs in areas where they are very densely mapped (OpenStreetMap).
So, instead of this rendering query for cliffs:
        select  geometry, type
        from osm_natural_ways
        where type='cliff'
I tried this:
        select  count(*) as density, st_collect(sq.geometry) AS geometry, type
        from
        (Select geometry, type, st_clusterdbscan(geometry,100,1) over() AS cluster
            from osm_natural_ways
            where type='cliff'
            and geometry && !bbox!) sq
        group by cluster, type
And split the simple style to this (isolated cliffs stay the same, densely mapped ones are smaller and less opaque):
#land_features[zoom>12] {

    [type='cliff']{
      [density > 8] {
        [zoom <=16]{
          opacity: 0.4;
          line-pattern-file: url(img/cliff.svg);
          line-pattern-transform: scale(0.6,0.6);
        }
        [zoom >16]{
          opacity: 0.6;
          line-pattern-file: url(img/cliff.svg);
          line-pattern-transform: scale(0.9,0.9);
        }
      }
      [density <= 8] {
        opacity: 0.6;
        line-pattern-file: url(img/cliff.svg);
      }
    }
}
Simple query result:
Elaborate query result:
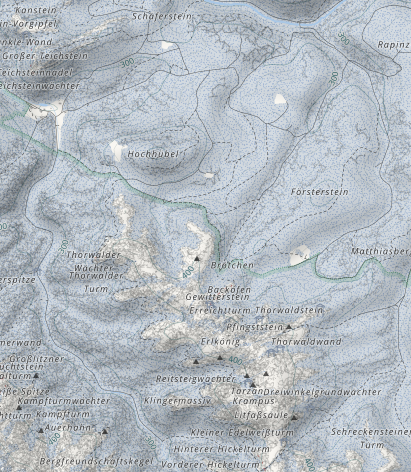
More importantly, this is not that expensive, except in densily mapped areas:
Area with cliffs:
- Simple query: 1.4ms
- ClusterDBScan query: 16.1ms
Area without cliffs:
- Simple query: 0.17ms
- ClusterDBScan query: 0.22ms
7 Likes