But the tile on culebre was last rendered on 20:08 and the tile is not marked as expired: Tile is clean. Last rendered at Tue Jun 18 20:08:46 2024. Last accessed at Tue Jun 18 20:08:46 2024. https://culebre.openstreetmap.org/19/282426/193722.png/status
There are several replies to my post which you’d need to move here, suggesting not all servers present the same thing where inserting a VPN and looking elsewhere half the planet round does give a fresh tile. Mine is now set to only look at the US for the OSM.org site.
Really it shouldn’t be - we have force expired all tiles generated before 20:45 UTC on 17th June on all render servers in order to ensure that any vandalised tiles are considered dirty.
I found this thread after encountering the same problem, i’ve made two edits in the same area, 23 hours and 45 minutes ago. The newer one is not yet visible, the older one only from the right VPN exit nodes.
The outdated tiles come from nidhogg and culebre, i originally thought that this could be the result of a high load on the tile servers after the vandalism, but looking at Grafana this doesn’t seem to be the case. The only suspicious metric is the file system usage, which is >90% for these two servers and much lower for all others i checked.
Render servers look suspiciously calm to me, compared to last 7 days (but I also get a “NetworkError when attempting to fetch resource” message in Grafana).
I found a bug in the new expiry code that meant it wasn’t expiring correctly so I have fixed that and force dirtied everything before this evening which is why the queues are now full while it catches up.
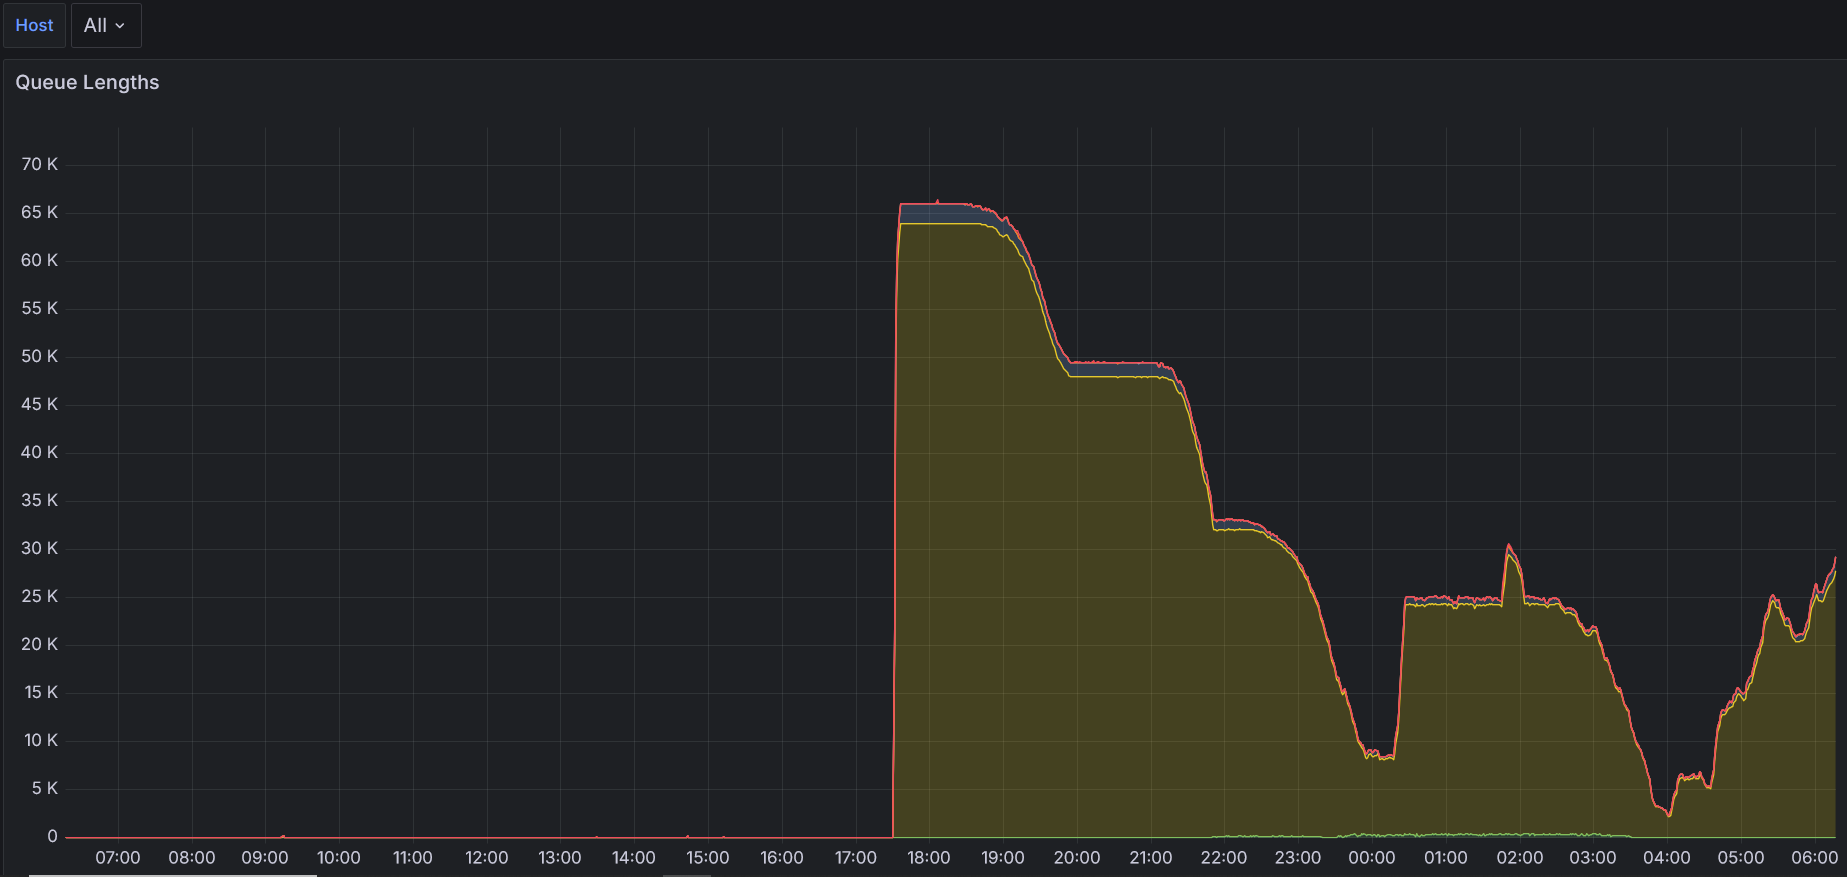
In general the queue is not the thing to look at though as in normal use we hope that there aren’t any - the mostly only arise during bulk re-rendering events.
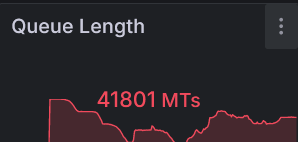
Thanks for that graph link… certainly know now where to look to get an indicator of some server processes needing kicking. For now the picture just over half a day later, most of it Europe asleep, the mappers that is.
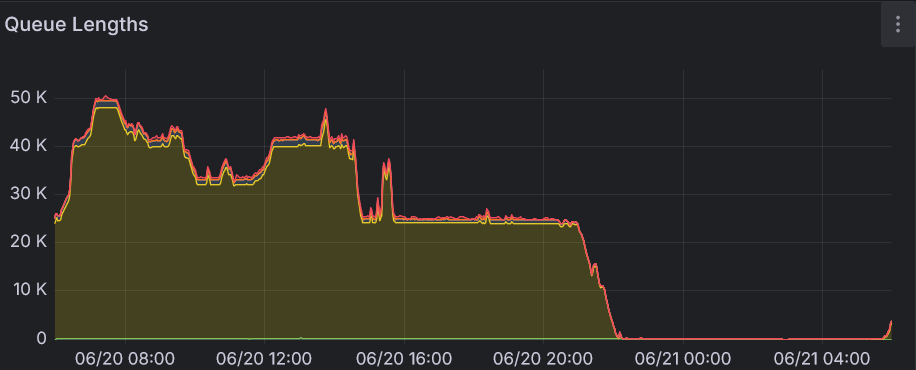
That picture is a bit misleading, as it shows an exceptional case of expiring all tiles, which was necessary because of the bug, and is usually only done after an openstreetmap-carto update. As TomH wrote, ideally this graph would show nothing, with empty queues in normal operation, just not in the current context.
The “Queue Lengths” graph is part of the “Tile Rendering” dashboard, which gives a better overview. Perhaps most useful for mappers in general are the top left “[dirty] Queue Length” and “Dropped” graphs and columns, which should both ideally be 0. Red indicates that some servers are not able to render all changes immediately:
the backlog in the dirty queue is rendered when servers are idle, usually in the evening
dropped tile rendering requests are ignored, best to try trigger rendering again in the evening with Ctrl + F5 on openstreetmap.org
No knowledge on my part what’s ‘normal’, the activity after Europe came on certainly jumped back up… Ctrl+F5 is taking longer before a new Carto tile shows up, at least the time to fetch a new cup of brew.
key to understanding is that when data is changed, the affected tiles are not rendered immediately, but only marked as expired by setting an old file timestamp
only when somebody actually looks at an expired tile on the map, it is queued for rendering and in the ideal case rendered on-the-fly within two seconds
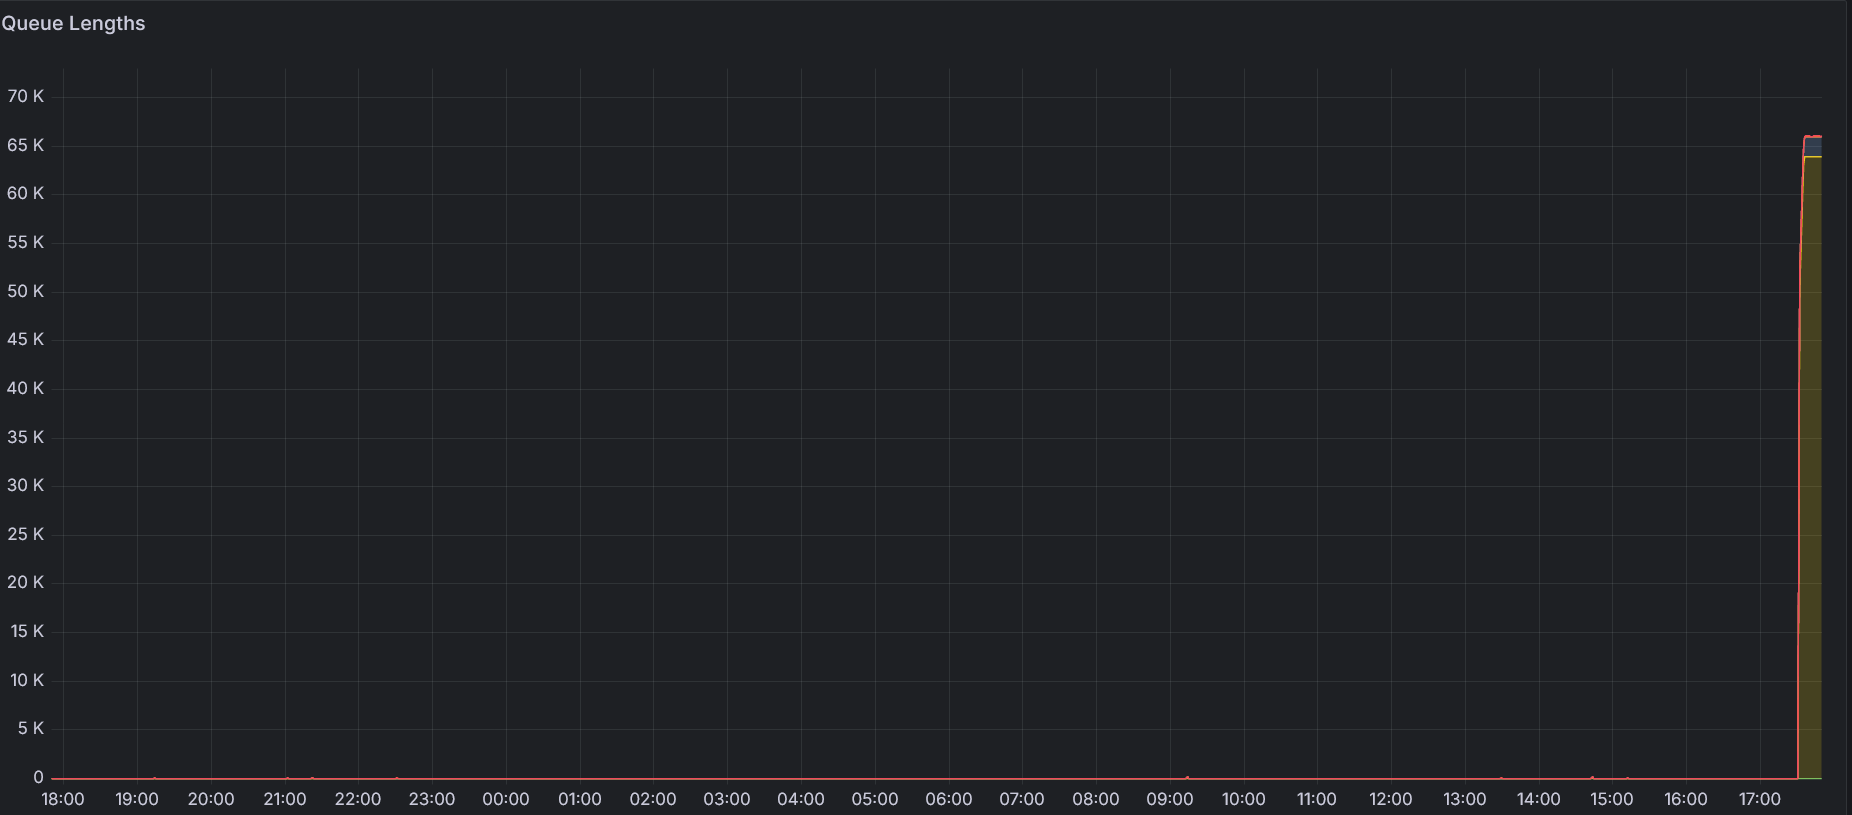
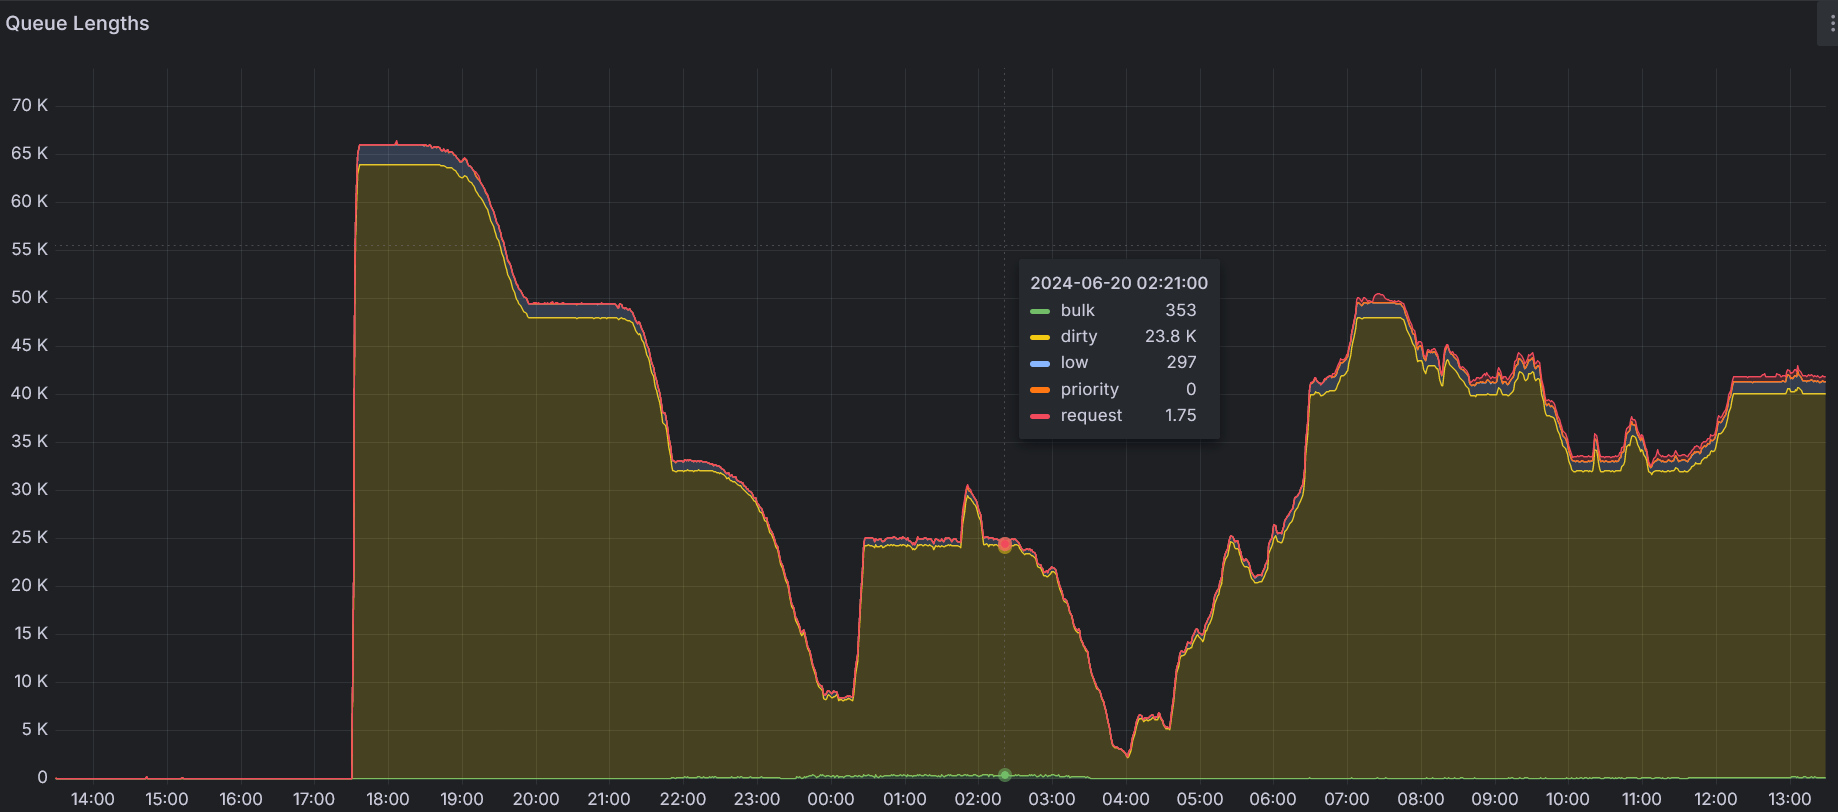
The first graph shows a sum of all queues, the small red one only shows the yellow “dirty” queue, which is currently the longest. You can see individual queues in the first by clicking on the name bottom left.