Yeah, that would be cool… ![]() goes off hackin‘
goes off hackin‘ ![]()
![]()
![]()
![]() New feature time!
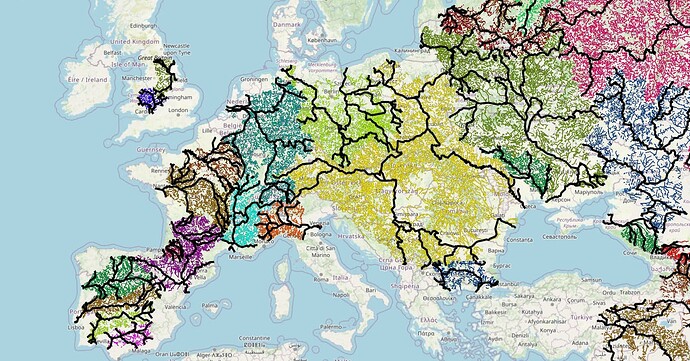
New feature time! ![]() Go in settings on WaterwayMap.org, and turn on
Go in settings on WaterwayMap.org, and turn on Frames. (direct link ![]() )
)
For each water basin/blob, it chooses a set of points at the edges, and draws a black line from each edge point to every other edge point. This shows how regions of the blob are connected.
It’s only available for the All Waterways and Natural Waterways maps, and only for waterway groups longer than 1,000,000 m long (→ code ![]() ). For my fellow data nerds
). For my fellow data nerds ![]()
![]() : It’s the shortest path between all the convex hull of the points in the graph. I can do algorithms, but graphics are not my strong suit. Here’s the map style if anyone wants to send me a patch
: It’s the shortest path between all the convex hull of the points in the graph. I can do algorithms, but graphics are not my strong suit. Here’s the map style if anyone wants to send me a patch ![]()
I’d love to do a Proper Algorithm™ like Betweenness centrality, but I couldn’t generate it in a sensible time. So I invented this “Frames” idea. Let’s see if it’s useful. Like all WWM data, it’s calculated every day. If you fix one mapping mistake
– ⓐⓜⓐⓝⓓⓐ ![]()
