I have just translate here my recent topic in the Spanish Community Forum to request global help because I guess my question is for Spain but could be useful for any other specific country.
I recently had an informal meeting with representatives of the National Centre for Geographic Information of the National Geographic Institute of Spain, CNIG, who are evaluating relationships and potential contributions to the OpenStreetMap project and its community beyond letting us use their data.
One of the questions that came up in the conversation was to be able to assess the importance of OpenStreetMap as a source of spatial data in quantitative terms: for example, how many visualisations are made of the web in Spain as well as how many data downloads are made from the data and similar questions.
For this community, the importance of OSM in quantitative and qualitative terms is unquestionable. Just go to the wiki to see it. However, when you are asked a question like the one above, the transmission of this information becomes complex, especially in quantitative terms and more relative to a given territory.
I’m opening this topic to see if we can centralise it here and then move it to the wiki those information. Then with the data and numbers we could convince institutions, companies and other agents to join this collaborative cartographic project and improve it together.
@msevilla00 Understanding OpenStreetMap’s quantitative impact regions like Spain poses a complex challenge due to the diverse nature of data usage and its relative influence. While centralizing discussions within the forum and moving essential information to the wiki could help advocate for the project’s value, obtaining precise quantitative assessments remains intricate. Collaborative efforts to gather and showcase this data might be instrumental in highlighting OSM’s significance to institutions and companies.
I guess we could start sharing some links or resources we could search withing the OSM data like OSMstats or, if you know, access to OSM tile servers from Spain or other country. Cheers
I can’t offer anything, but I am very interested in this topic. Impact assessment is very hard to do, mainly because “impact” is not a fixed thing, you have to define the kind of impact you are after.
In Nederland, OSM is used a lot, everyone sees it all the time, but mostly as a cheap and very detailed background map. Only Mappers recognize the source.
Actual user applications built primarily on OSM data are a very small niche in Nederland, mostly used by mappers. In hiking circles many more people use OSM, often without knowing it, because other maps simply lack the detail hikers need. Cyclists have more choice.
To sum up: cheap background maps and niche markets where the big commercial maps just do not offer the details.
Overture might change this position: OSM’s detail will be offered by the big commercial maps, including public methods to improve the map, so who will need special OSM applications any more?
Nederland has a very very elaborate cycling infrastructure, and OSM is by far the best map for that, for rendering and for routing. Even more because the many cycling routes and the country-wide cycling node network are included. But GM is getting better and better at displaying and routing the cycling infrastructure and cycling access.
Another important factor is trust. Many businesses and organizations simply don’t trust open source and open data. They would rather pay big bucks for stuff that comes with a SLA, maintenance fees and “assurance” or whatever it’s called today. If it’s good it can’t be free, right?
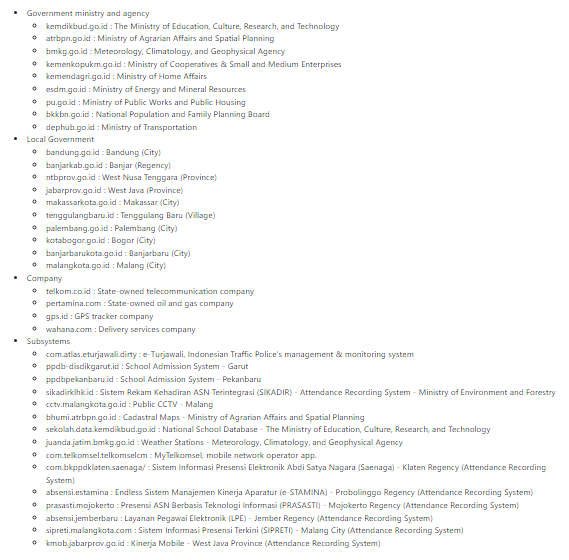
You can analyze the daily OSM Tile Log statistics for that.
While analyzing these statistics, I found out that there are many government institutions in my country already using OSM data for their daily operations.
Hi there, interesting topic… for open mapping for humanitarian use cases, understanding signals of impact (as others have said, measurement very hard) is also really important. We use some proxies on a regular basis to understand if and how the data created by local mappers and humanitarian (remote) mappers is being utilised for real world impact. To give two examples…
HDX is a platform for sharing humanitarian-relevant data and a place where hresponders, academics and other interested parties go to explore curated data sets. Each dataset has a downloads chart which shows the fluctuations in the demand. We generally use this in disaster response (activation) scenarios to see how demand changes for data as we invest time in creating it and increase the intervals at which it is made available. See here for the HOT section on HDX.
Not sure if there is something comparable for data dissemination in Spain or elsewhere…