While trying to mine OSM changeset data I came across an oddity. I plotted an activity center of mappers, given for each mapper by a GeoHash level 6 tile with the highest count of changeset centroids, not less than 20 changesets.
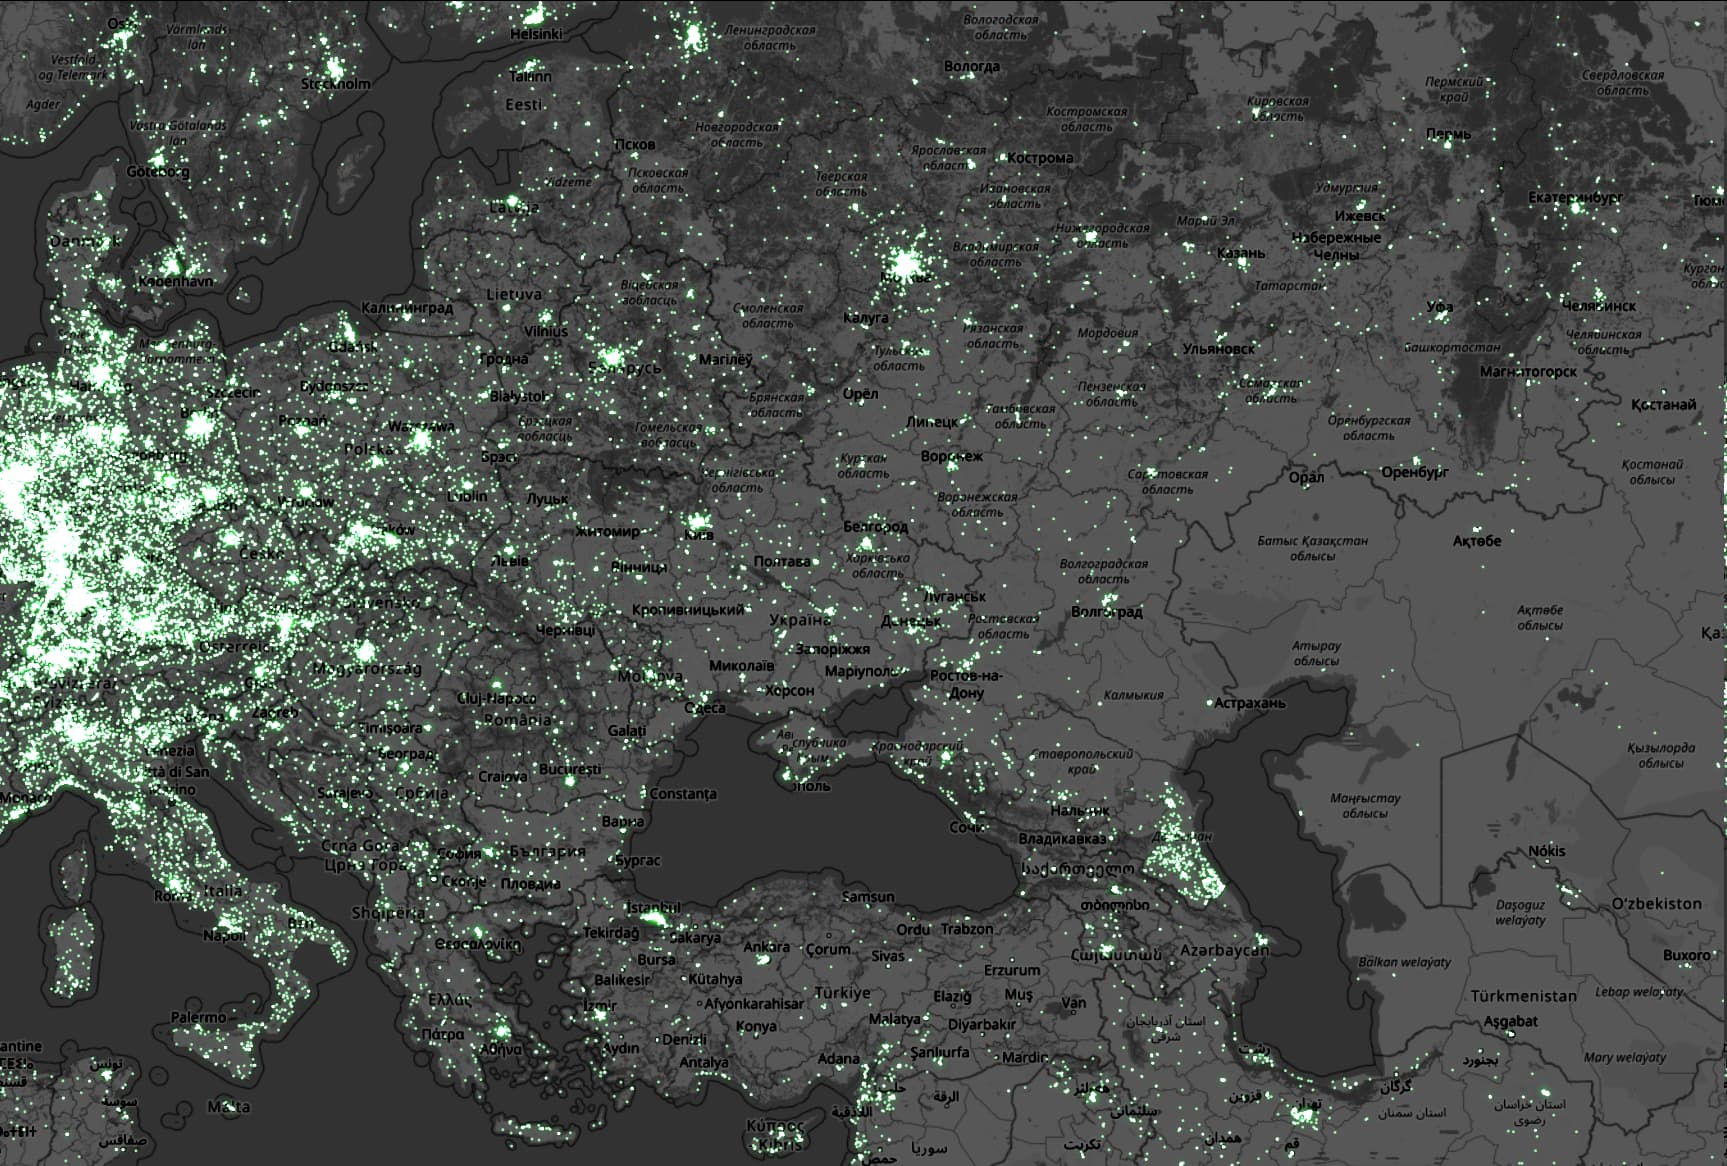
On such map Dagestan in Russia stick out quite a bit:
This can be correlated with Pascal Neis’ map (he uses a different methodology for the activity center that gives similar results).
Curiously enough, the population density map doesn’t show any concentration of people like that.
What gives?
Have you tried to list this mappers? Or their edits? Maybe something obvious will appear then, like HOT mapping Dagestan or someone creating new account every 20 edits.
There are definitely a few of my edits. There will be long holidays in our country and I plan to go to this region. It is popular with tourists, maybe they are getting ready too.
What kind of edits are there?
It was a some sort of organized editting.
Many municipal workers create address information (and buildings to hold them) before census 2020-2021.
But after this editting many errors were fixed by many mappers. So a number of edits was doubled or tripled