As to some more input to this discussion, I made a further attempt to compare the currently imported data with the official data as made available via Natural Resources Canada tools. I compared e.g. the data of the Toporama website (Toporama | Natural Resources Canada), that displays the official topographic maps in official styling if you zoom in enough, with the data imported in OpenStreetMap for a couple of regions (unfortunately, the Toporama site is terribly slow, making this a painful procedure…).
I learned a couple of things from this comparison:
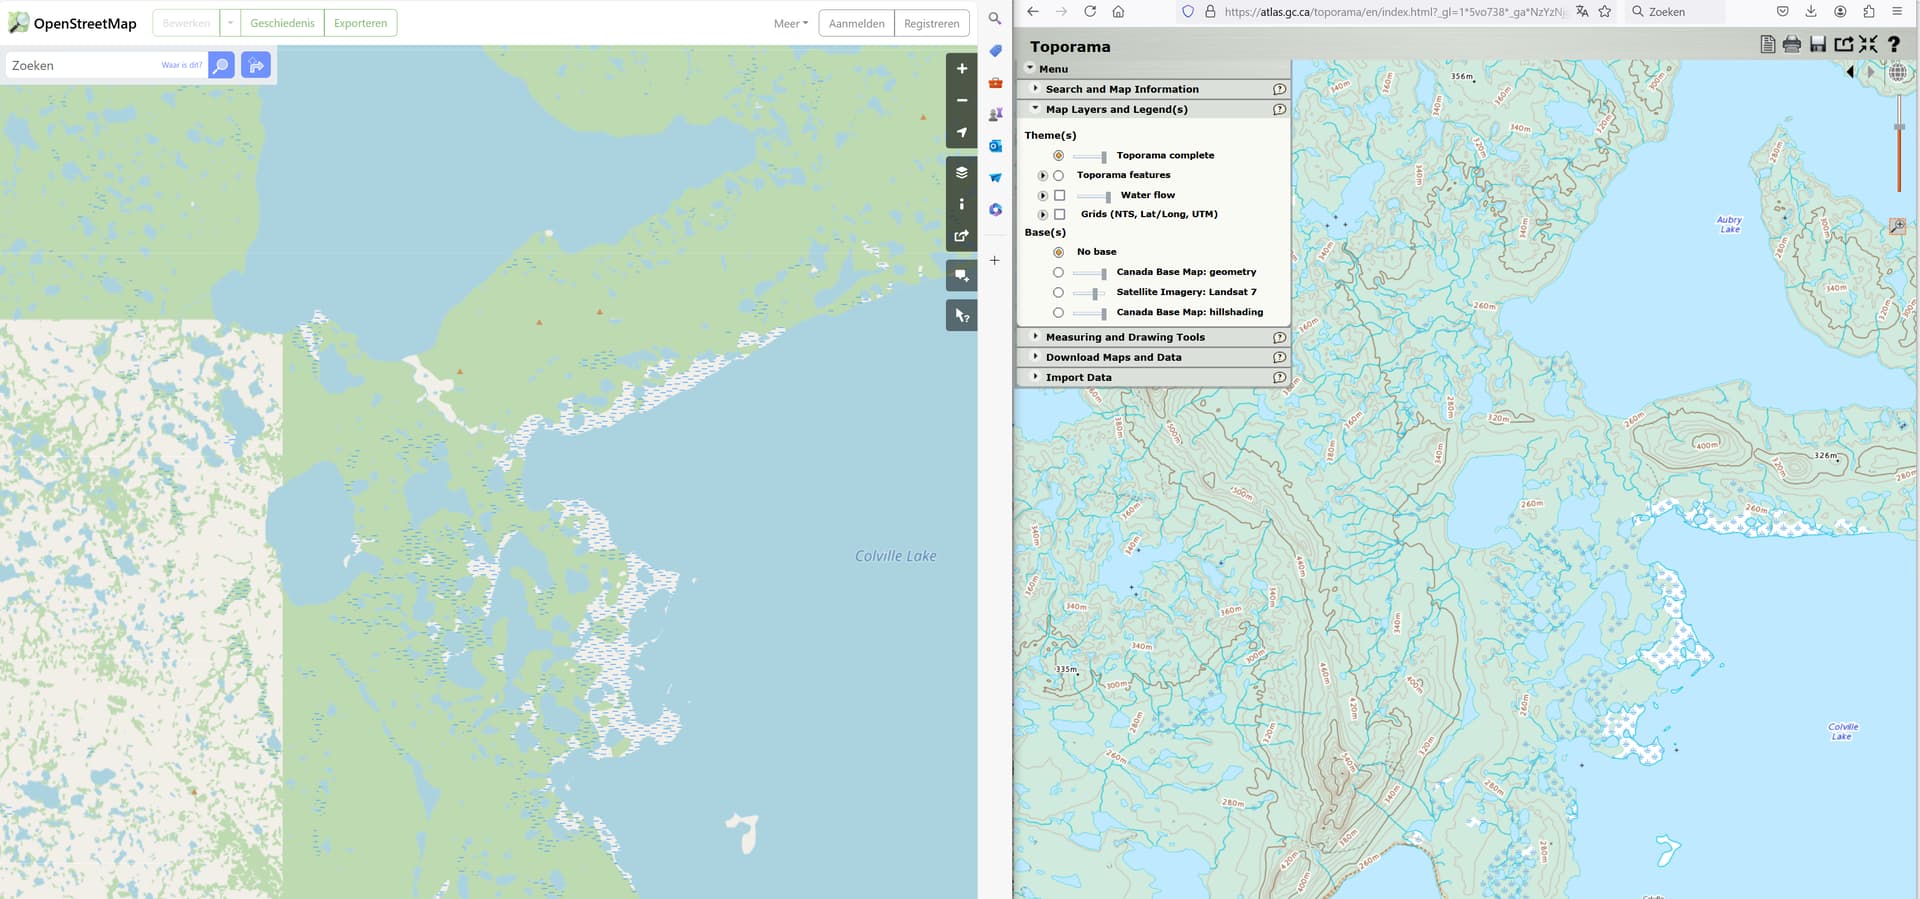
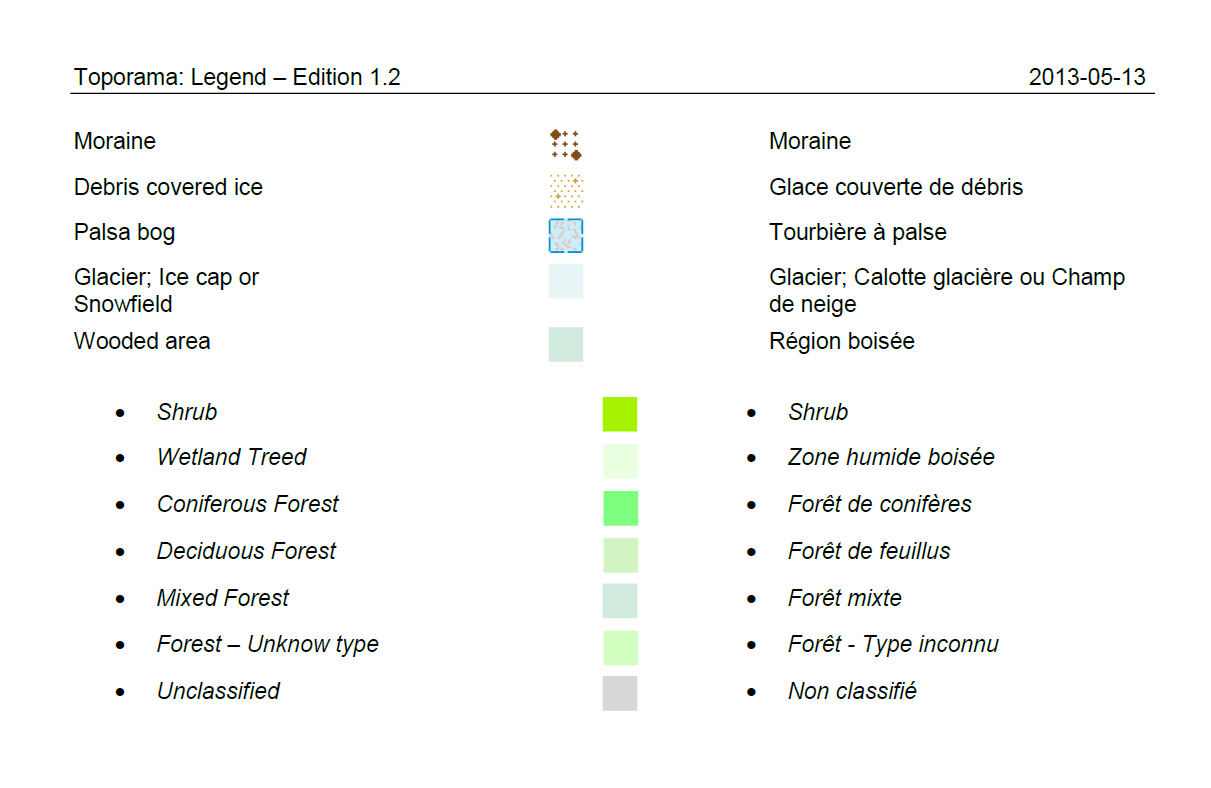
- The first image below shows approximately the same region as in my first post in this thread. Please note Toporama uses a different projection, leading to e.g. some rotation compared to OSM. As you can see from the Toporama image, the official maps appear not to show any distinction between "Forest / Dense forest / Open forest / Sparse forest, even though the base data source contains such information. This is also confirmed by the official map legend in the fourth and last image below, that shows the same base class color for all forest types, and then shows a possible sub-classification not based on density, but forest type (Confireous, Decideous, Mixed, Unknown), that however is not displayed on the Toporama site (it may be part of a dedicated printed map series, but IDK).
- Furthermore, it now appears that, contrary to my initial assumption about the tiles with less forest coverage being closer to “official” data, and tiles (almost) entirely green - especially up north - mostly likely caused by errors in topology interpretation, it now appears the almost entire green tiles may be closer to what NRC considers “forest” in its official maps. That also means they do not distinguish or interpret in their maps any of the density classes, and lump even “Sparse forest” under “forest”. The question remains of course if we, as OpenStreetMap community, want to do the same, or make our own interpretation of the data by e.g. excluding at least “Sparse forest” (which would mean the maps would look different than Toporama, but might be more closer to how someone “on-the-ground” experiences these areas).
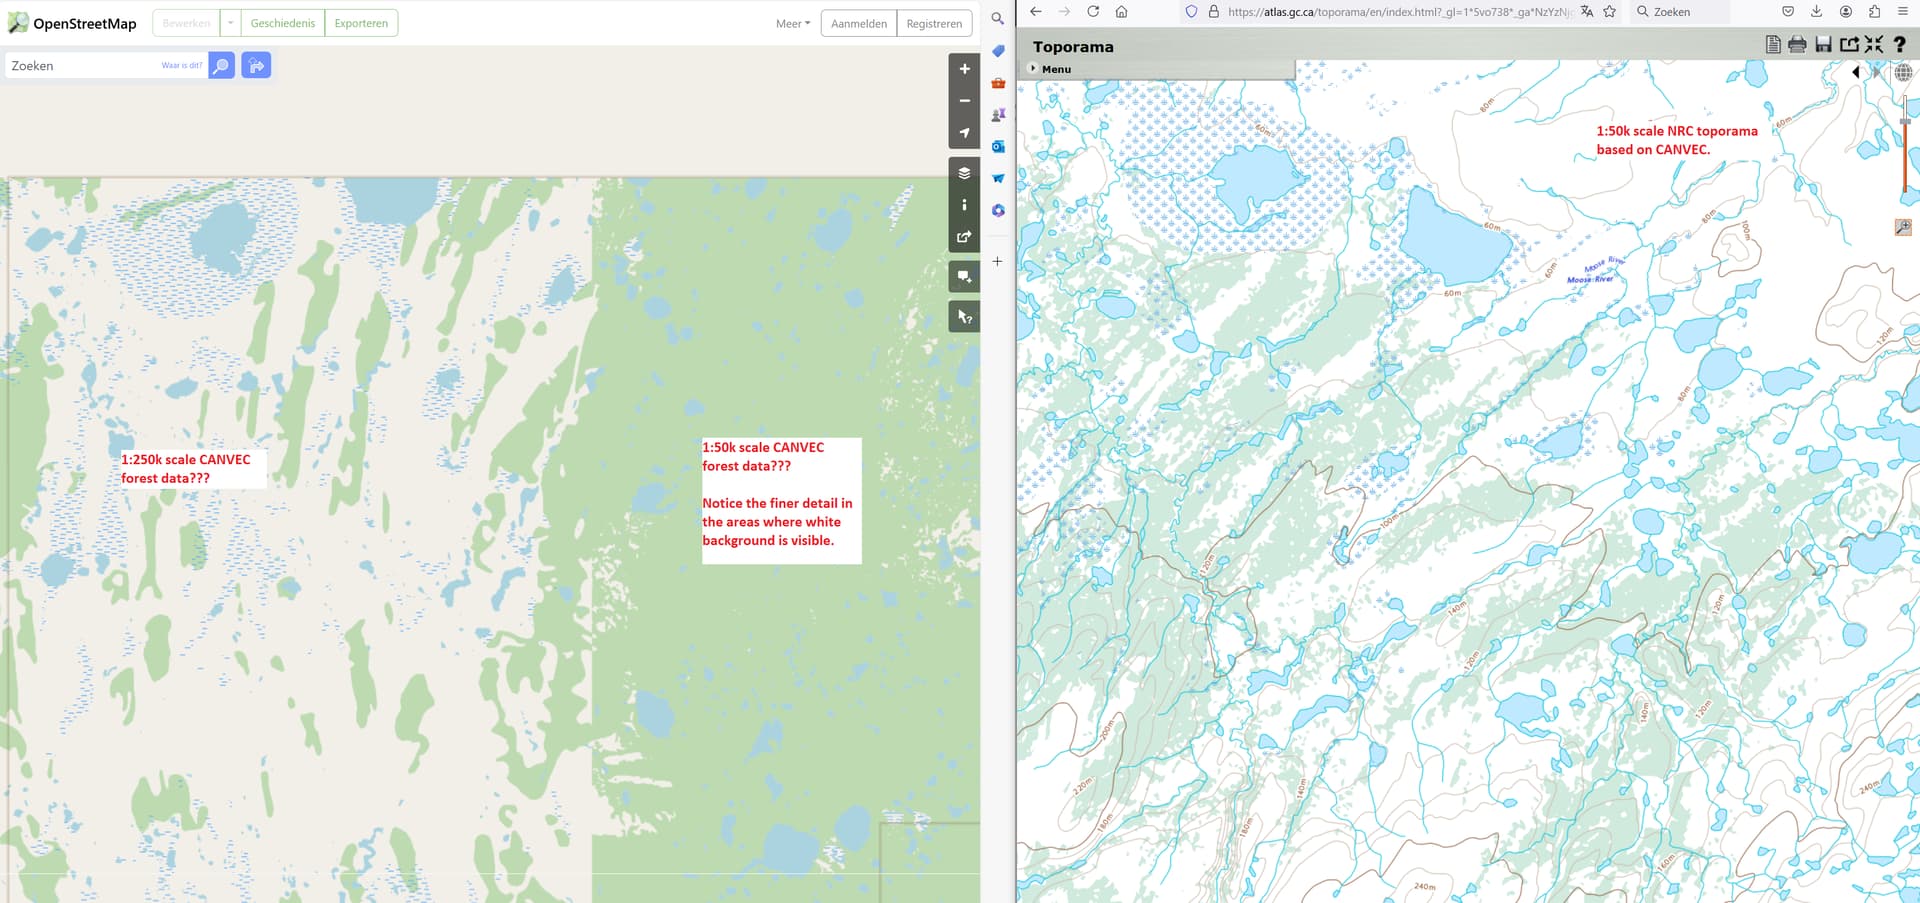
- There is another issue visible with the import in OSM in the second image. Not only do we again see the “whitish/green” tile difference on the tile boundary, but neither image matches the Toporama display on the right of approximately the same area. There is the added question and issue of Toporama being available in two official scales: 1:50k and 1:250k. Although this is highly speculative, it appears that some of the detail in the left OSM image (the left part), may be partially based on 1:250k data instead of 1:50k data, while the greenish part in the OSM data, which covers far to much of the extent if compared with Toporama, appears to show finer detail in the forest cover. This at least suggests that there may be another issue with the current import, where some data may be based on coarser 1:250k tiles. Of course, a mixture of scales is undesirable, and it would be recommended for any future tiles to be imported to standardize on the scale. Again, this is observation isn’t this clear for now, but the large differences, and also the severe mismatch between Toporama and OSM in this particular region, raise questions about the current import process.
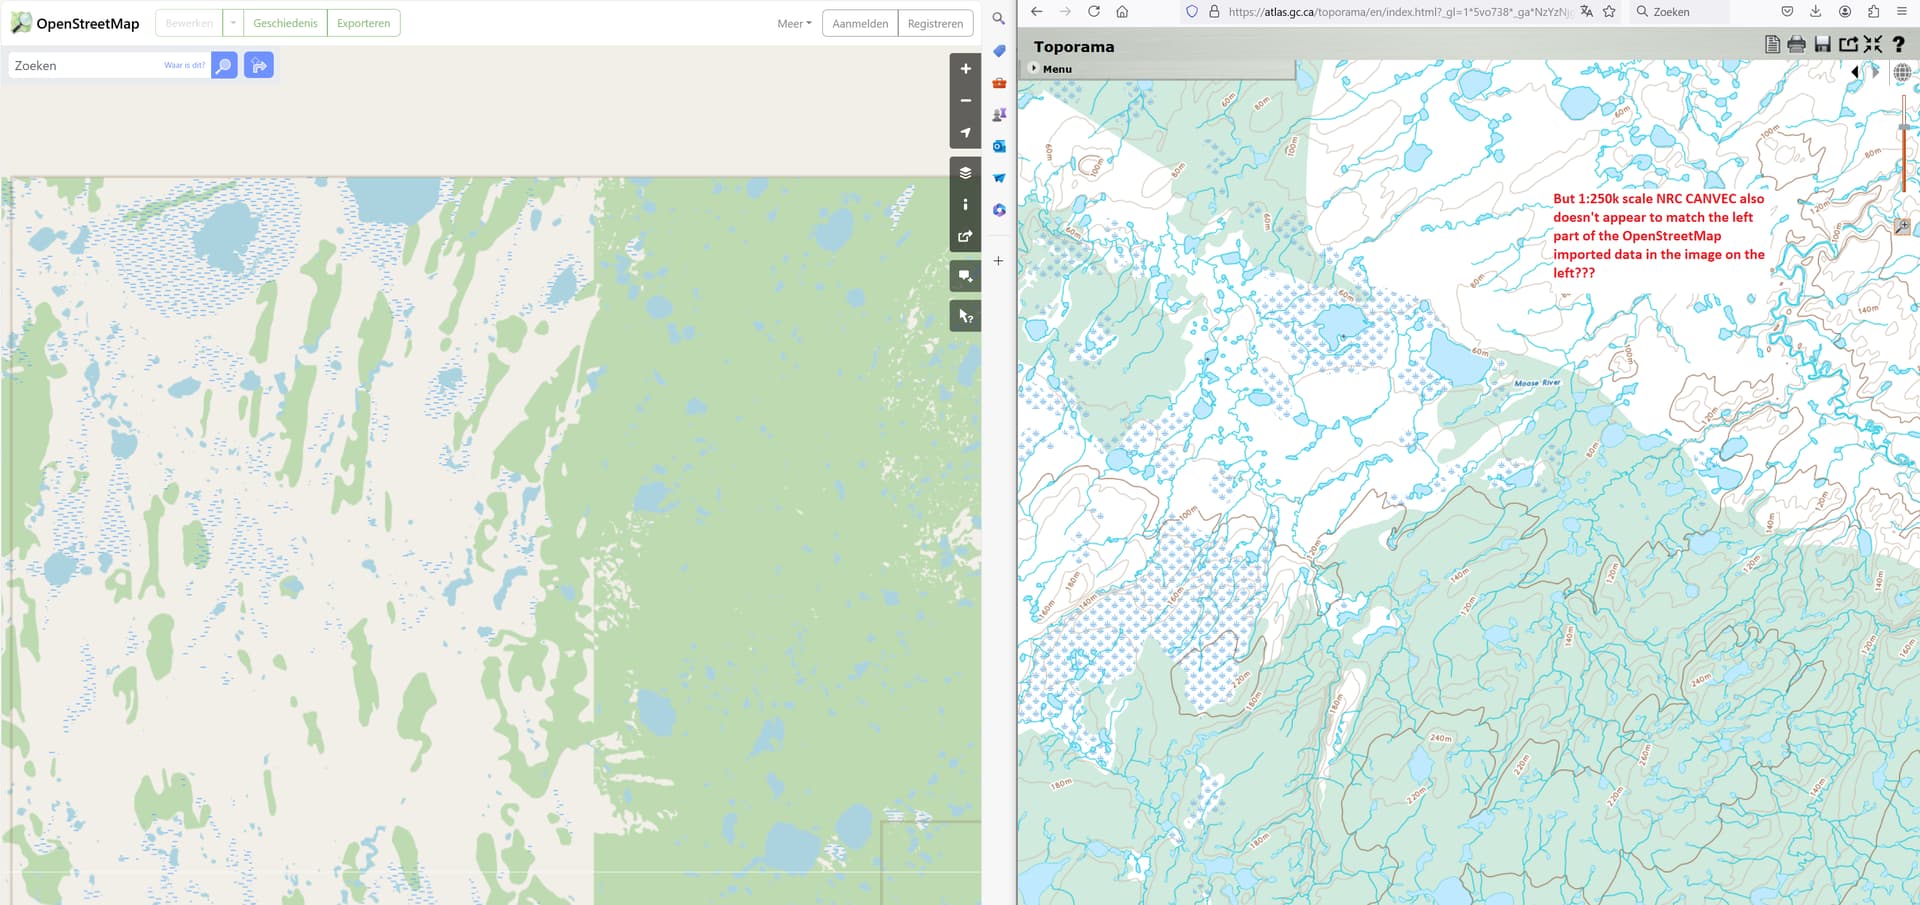
*As an extension of the last issue raised, the third image shows the same area, but with the 1:250k scale Toporama detail, that also doesn’t fit either of the two parts in OSM.
To summarize as to issues raised and questions to be answered:
- Does OSM / OSM Canada community want to follow NRC standard of no distinction in forest density and/or type?
- What scale should and is being imported (1:50k or 1:250k with likely the former being the preference)?
- How to avoid all of the issues detected so far?