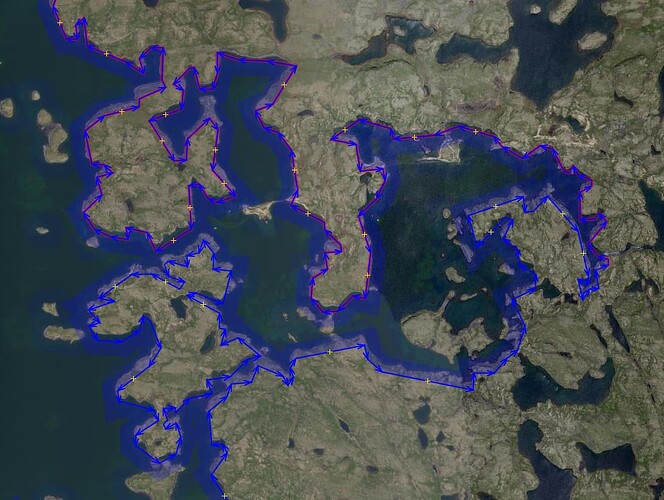
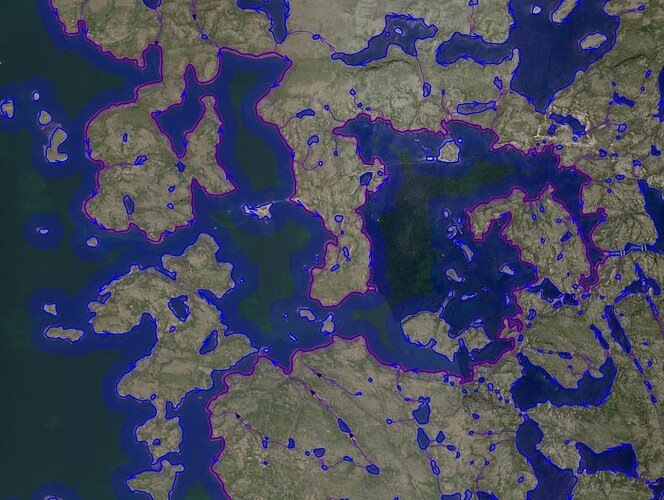
Given that the import consultation was on up to date data, I believe anyone proposing to import Canvec should be going through the normal import process as the previous decade-old proposal does not cover this. What are others thoughts?
I would oppose a blanket prohibition on importing Canadian landcover data dated 2012.
This is because most wilderness areas would not have changed significantly.
Yes some ponds silt up and trees grow and burn, but on the whole, a forest in northern Canada in 2012 is exceedingly likely to still be a forest in 2024, and a lake still a lake.
Importer discretion is necessary, but this is always the case.
(In inhabited areas it is a different story)
Is there any more recent landcover vector data available we should we using instead?
As to some more input to this discussion, I made a further attempt to compare the currently imported data with the official data as made available via Natural Resources Canada tools. I compared e.g. the data of the Toporama website (Toporama | Natural Resources Canada), that displays the official topographic maps in official styling if you zoom in enough, with the data imported in OpenStreetMap for a couple of regions (unfortunately, the Toporama site is terribly slow, making this a painful procedure…).
I learned a couple of things from this comparison:
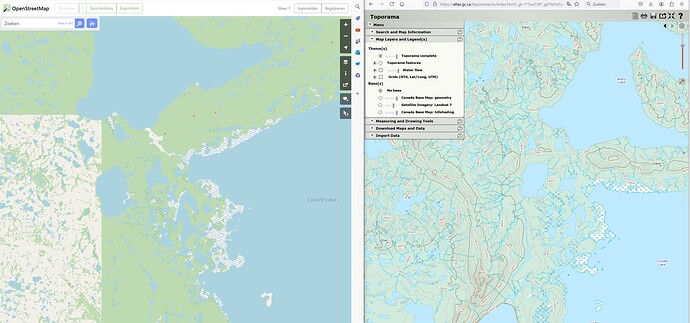
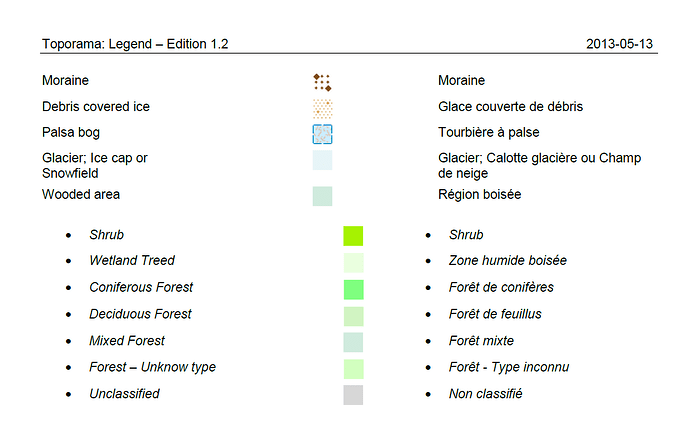
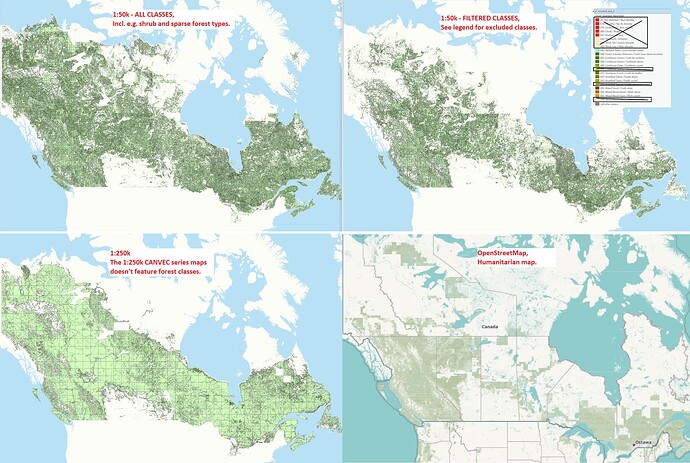
- The first image below shows approximately the same region as in my first post in this thread. Please note Toporama uses a different projection, leading to e.g. some rotation compared to OSM. As you can see from the Toporama image, the official maps appear not to show any distinction between "Forest / Dense forest / Open forest / Sparse forest, even though the base data source contains such information. This is also confirmed by the official map legend in the fourth and last image below, that shows the same base class color for all forest types, and then shows a possible sub-classification not based on density, but forest type (Confireous, Decideous, Mixed, Unknown), that however is not displayed on the Toporama site (it may be part of a dedicated printed map series, but IDK).
- Furthermore, it now appears that, contrary to my initial assumption about the tiles with less forest coverage being closer to “official” data, and tiles (almost) entirely green - especially up north - mostly likely caused by errors in topology interpretation, it now appears the almost entire green tiles may be closer to what NRC considers “forest” in its official maps. That also means they do not distinguish or interpret in their maps any of the density classes, and lump even “Sparse forest” under “forest”. The question remains of course if we, as OpenStreetMap community, want to do the same, or make our own interpretation of the data by e.g. excluding at least “Sparse forest” (which would mean the maps would look different than Toporama, but might be more closer to how someone “on-the-ground” experiences these areas).
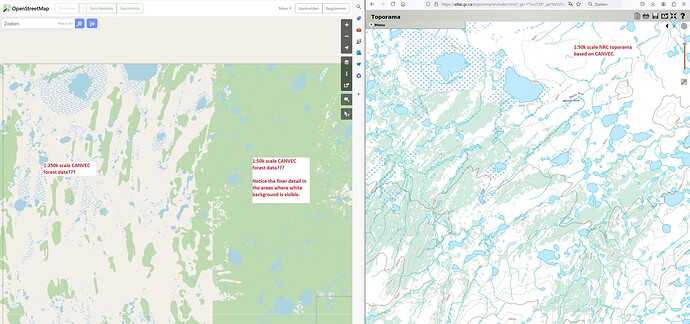
- There is another issue visible with the import in OSM in the second image. Not only do we again see the “whitish/green” tile difference on the tile boundary, but neither image matches the Toporama display on the right of approximately the same area. There is the added question and issue of Toporama being available in two official scales: 1:50k and 1:250k. Although this is highly speculative, it appears that some of the detail in the left OSM image (the left part), may be partially based on 1:250k data instead of 1:50k data, while the greenish part in the OSM data, which covers far to much of the extent if compared with Toporama, appears to show finer detail in the forest cover. This at least suggests that there may be another issue with the current import, where some data may be based on coarser 1:250k tiles. Of course, a mixture of scales is undesirable, and it would be recommended for any future tiles to be imported to standardize on the scale. Again, this is observation isn’t this clear for now, but the large differences, and also the severe mismatch between Toporama and OSM in this particular region, raise questions about the current import process.
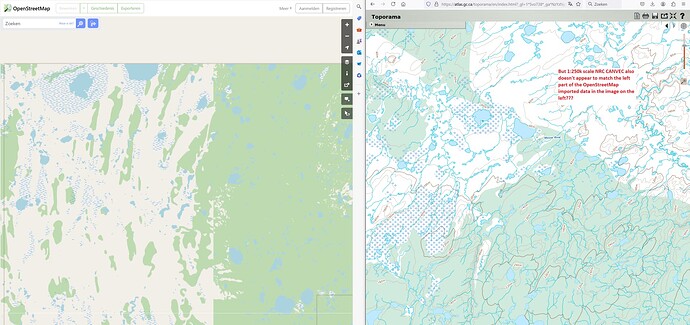
*As an extension of the last issue raised, the third image shows the same area, but with the 1:250k scale Toporama detail, that also doesn’t fit either of the two parts in OSM.
To summarize as to issues raised and questions to be answered:
- Does OSM / OSM Canada community want to follow NRC standard of no distinction in forest density and/or type?
- What scale should and is being imported (1:50k or 1:250k with likely the former being the preference)?
- How to avoid all of the issues detected so far?
I will chime in with my observations from BC and my opinion on the imports. Overall, I have found the Canvec data to be very helpful for waterway mapping in natural/undeveloped areas and overall unhelpful in developed areas.
The stream data is very useful since I do not have a lot of confidence in determining stream locations using only the aerial imagery. These streams are unlikely to be mapped by another means. In any area where development has occurred, the stream data can be incorrect but this is more likely to be ‘caught’ because there will be mapper attention given to the roads, buildings, etc that is to be added to the map. Most rivers have changed their course slightly and their water=* area boundaries no longer exactly match the Canvec data but I am okay with this since the data is close enough. Rivers are going to continue changing anyways.
The forest data is not reliable in developed areas (towns, industrial sites, etc). While I like to see the ‘zoomed out’ map covered in green, I find the ‘zoomed in’ map to over estimate forest cover. It can be a pain to fix because of all the funny shapes and complex relations.
I would be opposed to completely blocking future imports. Other than streams, rivers, ponds, glaciers, forests, marshes, what is included in the Canvec data? With my experience in BC, I would understand preventing additional forest data but the rest has been mostly helpful.
Maybe this is just how the original data is, but I would be nice to improve how the Canvec water data is imported. Most streams and rivers seem to end at the water=* area boundary but it would be better for them to continue so that all the waterway=* connect. For example, when a river has a water=river area mapped, each waterway=stream that flows into the river stops at the boundary of this area instead of connecting to the waterway=river. I would be best if each waterway=stream connected to the waterway=river it flowed into.
Depending on the region, I’ve also seen it include highways, power lines, pipelines, addresses, POIs, coastlines, cutlines, railways, mountain peaks, residential areas, and maybe more that I can’t think of off the top of my head.
Your last paragraph about connecting waterways together is something me and others have discussed for a while on the OSM discord. The idea is to use a script or something to connect the “easy” work (1 input stream, 1 output stream) and then do more complicated water areas with multiple inputs or outputs by hand. That, however, falls into the “cleanup” category in my opinion.
I cant speak on developed areas, jmarchon is a much better resource for that, but in the rural areas that I map, canvec data has:
Waterways, streams, water areas, wetlands, sand, mountain peaks, landforms, eskers, and the occasional tiny settlement with buildings and highways (although this is extremely rare, as there is little to no development in the northwest territories).
I’m not ignoring this post by responding to others - I will add my input on scales and different tiles tonight, but I have to go to work now so that wont be until around 3am UTC. I have seen different scales and they are easy to identify. But I will do a write up tonight.
As I participated in the creation of the Canvec/OSM product. I’ve updated the Canvec wiki page to have an informed discussion about what was produced 12 years ago and what is currently available.
Please feel free to ask questions as the Canvec product and available documentation are quite complex.
I added details about the Canvec/OSM product in the wiki page. I’m sure what you saw can be explained from the following excerpt.
The different versions of the product were created alongside the replacement of the roads (RRN), hydrography (RHN) and vegetation layers mentioned above. Therefore, each available or imported dataset may or may not contain these updated layers.
Thus, even the latest available Canvec datasets (OSM format) may result from an earlier photointerpretation. The clear edge of vegetation between the two adjacent datasets was common at that time. Mapping teams did not necessarily have access to or use adjacent maps to adjust their interpretation.
No one is suggesting that. A new CanVec import would be treated as any other import.
What is the difference between the current ongoing CanVec import being discussed in this topic and the new CanVec import you have in mind?
If I may chime in from the sidelines, besides the fact that CanVec is out of date now, even when it wasn’t it still had this issue where different layers wouldn’t match - the lake would overlap the hole in the forest like with this nicely named lake in BC: Way: And Another Lake (195584173) | OpenStreetMap - and dont’t get me started on importers just chucking the data in without even noticing these issues. If I see an import like that today, I revert it and tell the importer that they have an obligation to ensure that the data being imported matches what is already there.
Interesting example!
Context: The problem you mention was identified shortly after NRCan began replacing existing vegetation with that of the Canadian land cover (image classification). The replacement process has been modified to, at least, remove vegetation from the water. The latest version of Canvec was produced before all vegetation was reprocessed. This is why we find the problem in western Canada (your example: 092H16), but not in the east (ex. 021E07). Processing was ordered by NTS numbers.
Personally, I don’t find the “new” Canvec vegetation layer accurate enough to import. The same is true for the data from the Land Cover of Canada product. This can help with interpretation but the geometry should not be used.
They would be required to provide the appropriate import documentation and consult with the community on what they intended to do. The current situation with CanVec is that we have no idea what the import agreed on was supposed to be.
Thus, even the latest available Canvec datasets (OSM format) may result from an earlier photointerpretation. The clear edge of vegetation between the two adjacent datasets was common at that time. Mapping teams did not necessarily have access to or use adjacent maps to adjust their interpretation.
To get some more insight into the problems of the CanVec data being based on different data sources, I have decided to do some more research, and taken the drastic descision to download all of the CanVec “Land Features” dataset, which includes a feature class “wooded_area_2” for Polygon type features, as ESRI File Geodatabase from the Natural Resources Canada provided FTP site at both 50K and 250K scales:
https://ftp.geogratis.gc.ca/pub/nrcan_rncan/vector/canvec/fgdb/
I then visualized this in GIS, and made some filtering comparisons where I excluded some of the classes as encountered in the ‘wood_coverage_descriptor’ field of the feature classes.
All in all, this is a pretty massive amount of data. Each of the 13 FGDBs that together cover most of Canada contains upwards to several million woodland polygons. I wouldn’t be surprised if a full import of all CanVec “Land” and “Hydro” features alone could result in some 100M polygon and line features total being added to the OSM database for woodland, shrub, wetland, lake and river/stream features if based on the 1:50k dataset.
Although not displayed, I also downloaded the “Hydro Features” dataset, and had a quick look at the problem highlighted by @woodpeck of water features not matching forest or other vegetation. From a quick review, it appears these issues may be very limited, at least in the latest CanVec data I downloaded. In this superficial review, I saw a limited amount of such issues as highlighted by @woodpeck in the downloaded data, but nothing to obvious and disturbing.
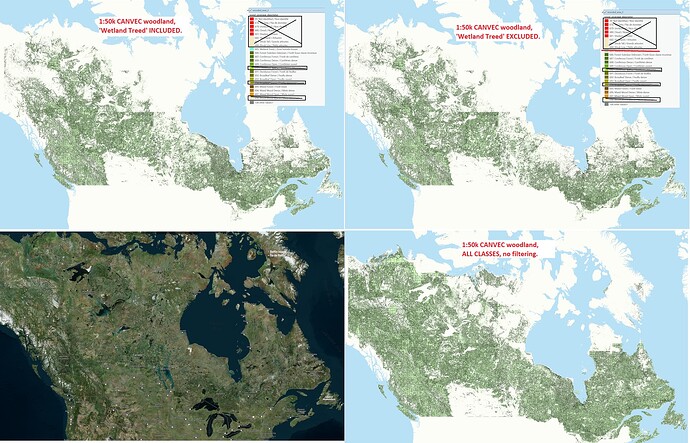
To get some better insight in the data, I then made the comparisons as shown below, which includes filtering of the ‘wood_coverage_descriptor’ field as already described above on the classes that I also showed in the initial post of this discussion thread. The 1:250k scale maps, for obvious reasons as likely being a derived generalized version of the 1:50k scale data, doesn’t have meaningful data in the ‘wood_coverage_descriptor’ field (although it is included, all rows are set to “Not identified”). So selections of classes were only maded on the 1:50k scale data. Two types of selection were made:
- Exclude anything unidentified, shrub or sparse forest
- Exclude anything unidentified, shrub, sparse forest + wetland treed
These selections are compared to the 1:250k view and the current OpenStreetMap forest data as displayed in the Humanitarian style (first image), and against a view with the imagery and 1:50k data without filtering anything, so shrub and sparse forest classes included (second image).
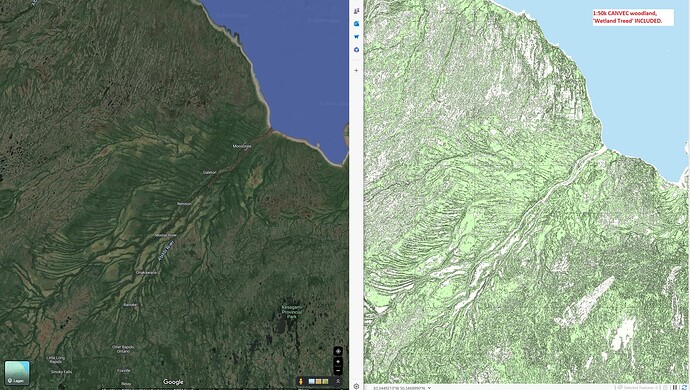
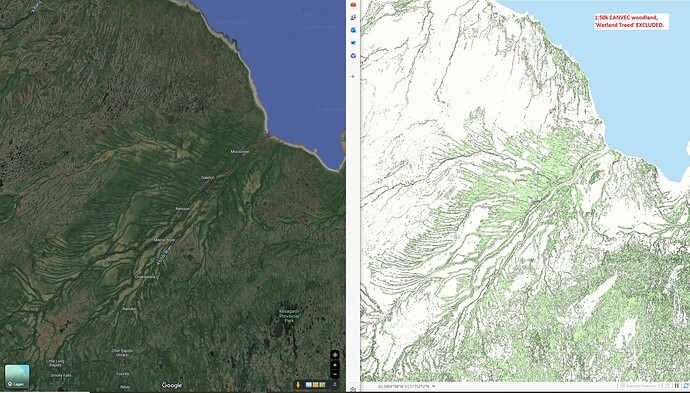
I then also compared the forest cover with “Wetland Treed” excluded and included for a detail section in the south of the Hudson Bay, where there appear to be huge wetlands along the lake’s perimeter.
I think I can draw a few more conclusions now:
- Although my initial thought was that the import processes were responsible for most of the issues detected with non-matching tiles, it is now very obvious seeing the entire dataset, that the disparate data sources are a major source of discontinuities between tiles as well. But this doesn’t exclude major issues with the importing processes as well.
- Even if the best import practices are followed, major discontinuities between tiles will remain due to CanVec origins and disparate data sources, see the images that display many of such issues, and even entire sections / tiles missing.
- I personally have the feeling the exclusion of ‘shrub’, ‘sparse’ and ‘wetland treed’ classes, appears to match satellite imagery and what constitutes “forest” closest. But this is to a large extent an arbitrary personal judgement, and it will be up to the Canadian community whether any future or re-newed import needs to use any specific set of forest classes. Without local knowledge of areas, judging or gauging relatively coarse satellite imagery, is really hard and potentially fraud.
- I also wonder if it would potentially be possible for NRC to provide a new, and potentially selective set, of *.osm tiles using the conversion processes used in the past, but with the latest data as available in e.g. the FGDBs. Although many have stated CanVec hasn’t changed since 2012, that statement appears at least somewhat related to the date the original *.osm files were created, not necessarily the current state of affairs and data available at NRC. Would it make a difference if a new export was made?
First image:
Second image:
Wetland Treed included or excluded:
It may be possible to find out which classes are used in the new Canvec “vegetation” layer by contacting geoinfo@nrcan-rncan.gc.ca.
I can’t answer on behalf of NRCan, but the last contact I had with these people tells me that this is no longer one of their priorities.
Maybe I agree with @pnorman. The CanVec/OSM product is no longer updated and some of its feature types were already obsolete when the product was created. This was the main reason why NRCan got involved with OSM… updating these features with the help of the OSM community.
Given all that has been said, I think we should discuss which layer(s) of the CanVec/OSM product could still be imported, if any.
I am currently working on importing in northern Québec. Looking at aerial imagery, the Canvec data there (almost exclusively streams and lakes, no forests) seems to be consistently more accurate and much more complete that the data already in OSM. I think it would be a shame to stop all importing of Canvec data.
I agree, but do we continue to import the entire Canvec/Osm content (i.e. buildings, vegetation, roads) or only the natural=water* elements (i.e. waterbodies and waterways)?
Geobase (NHN) could be another source, but the data must be transformed into osm format, unlike Canvec. Any thoughts about it?
