Checking for available updates of gtfs data is now fully automated in ptna
at 13:15 CET/CEST, a cron job checks for updates
why at 13:15?
that is for the Pacific time gap: the time between public-transport analysis of OSM data for US-AK-Anchorage-PTD (UTC-09) at 13:02 CET/CEST and AU-NSW-Sydney (UTC+10) at 18:02 CET/CEST which will avoid interferences between GTFS update and PTNA report creation
only the first GTFS data of a month is updated
why?
to save disk space on the server
some GTFS feeds change (shuffle) route_ids and/or trip_ids with every new (daily?) update, OSM mappers might become annoyed by changing/adapting OSM data so often
the update report of GTFS data is available here with the following content examples
2024-10-16 versus 2025-01-08 - not yet analyzed (new) : new GTFS data is available and will be updated on the server
2025-01-08 - OK GTFS data is up-to-date
2025-01-08 versus 2025-01-18 - skip(ped) version : the last update was on 2025-01-08, the latest available data is as of 2025-01-18 but has not been published on the server
2025-01-03 versus 2025-01-20 - same month : the last update was on 2025-01-03, today there was new data available but has not been published on the server
unknown release date: HTTP/2 403 : access to the GTFS data is forbidden: registration required or protected by Cloudflare or … will not be fixed in PTNA
unknown release date: HTTP/2 404 : the data could not be found. Kindly let my know if you know the (new) location
unknown release date: date: invalid date ‘content-disposition: inline; filename="provenceverte-pg-80x80.pdf"\r’ : could be same as “HTTP/2 404”, file has moved?
logging reports for individual updates can be found here
no logging link: update has been done manually
At any time you can request a manual update of GTFS data by contacting me
On both pages you will see an injection needle if the GTFS data differs from the OSM data or the OSM data does not have GTFS data set. Hover the mouse over the icon will show you what needs to be changed or inserted. A running josm instance with remote control enabled will be used, asking you for confirmation.
I did some edits using this and it makes GTFS updates on OSM data much faster and less boring
no copy of route_id or trip_id from the page
no find and select the appropriate route_master or route relation in JOSM
no paste of that (multiple) data into the corresponding tags of the relation
just click and confirm
just upload, wait 2 minutes and refresh the comparison page for verification
As always: you might have to refresh your browser’s cache, CTRS F5 is your friend
As always: feedback is highly welcome
Edit: 2025-01-23 17:17 CET some clarification and: I fix a bug in “gtfs:trip_id:like” handling
Edit: 2025-01-23 23:39 CET some clarification
Thanks for the update, works super smooth and reduces the hassle of updating GTFS a lot!
While I have the compare page open, it will obviously take me a few days to learn how to use the Mismatch Score Table feature I just discovered there.
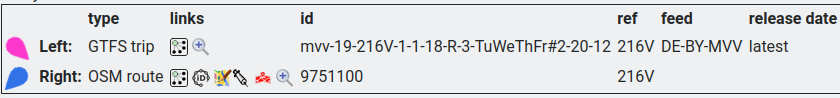
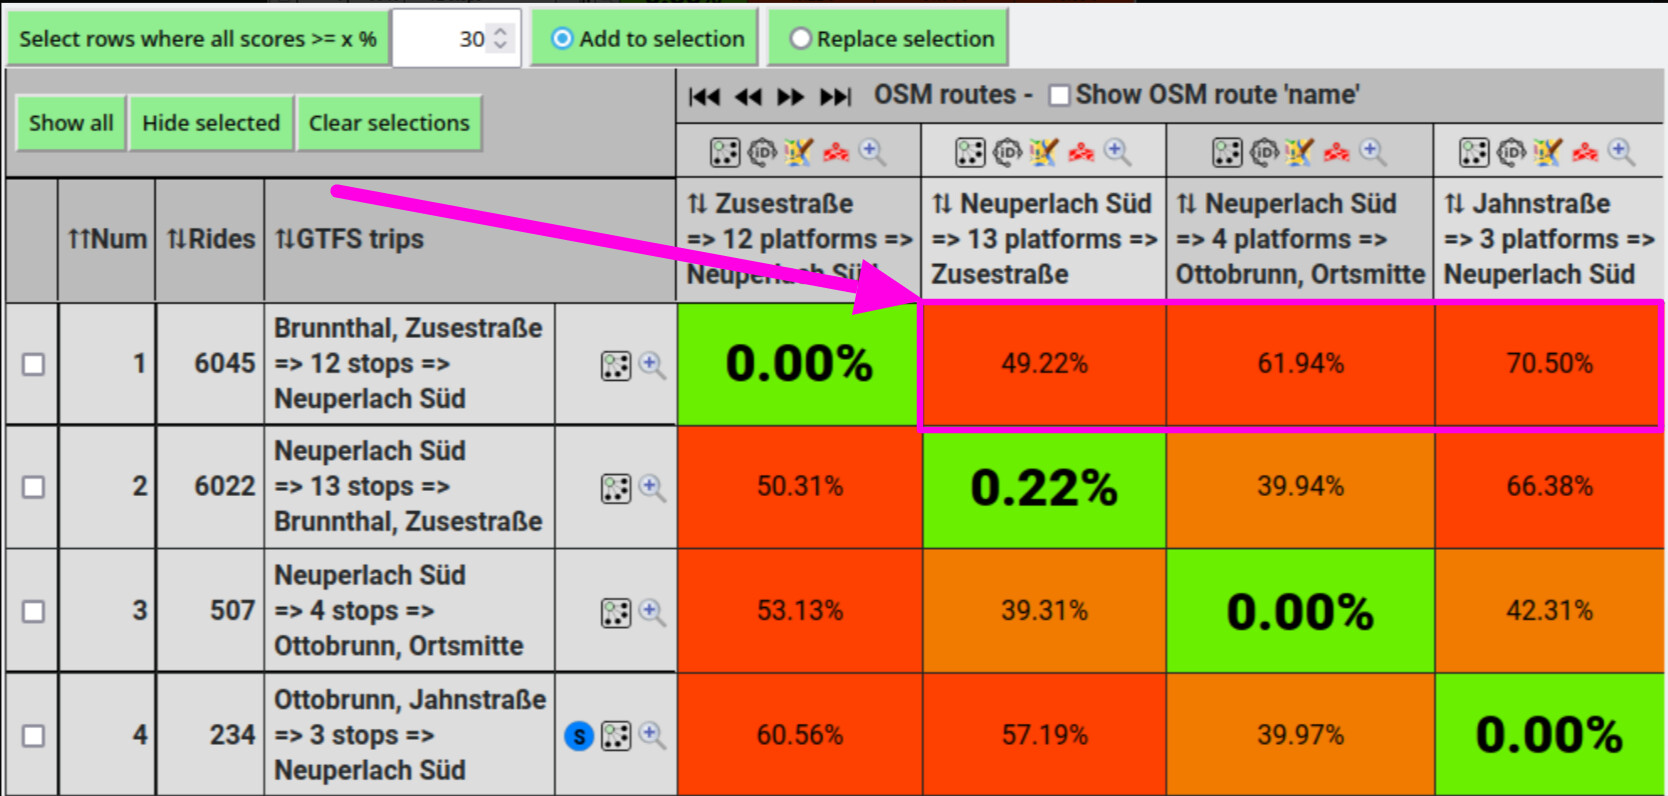
I guess I’ve understood the basics of table more or less. You have to select the GTFS routes (first column) that are also integrated into OSM. And then you can see what the value is on the far right of the table
At least in my transport association, there is a relevant outward and a return journey. The question is, why are both OSM directions displayed for a GTFS trip (which can only have one direction)? It is clear that the wrong direction in this case receives a very bad value.
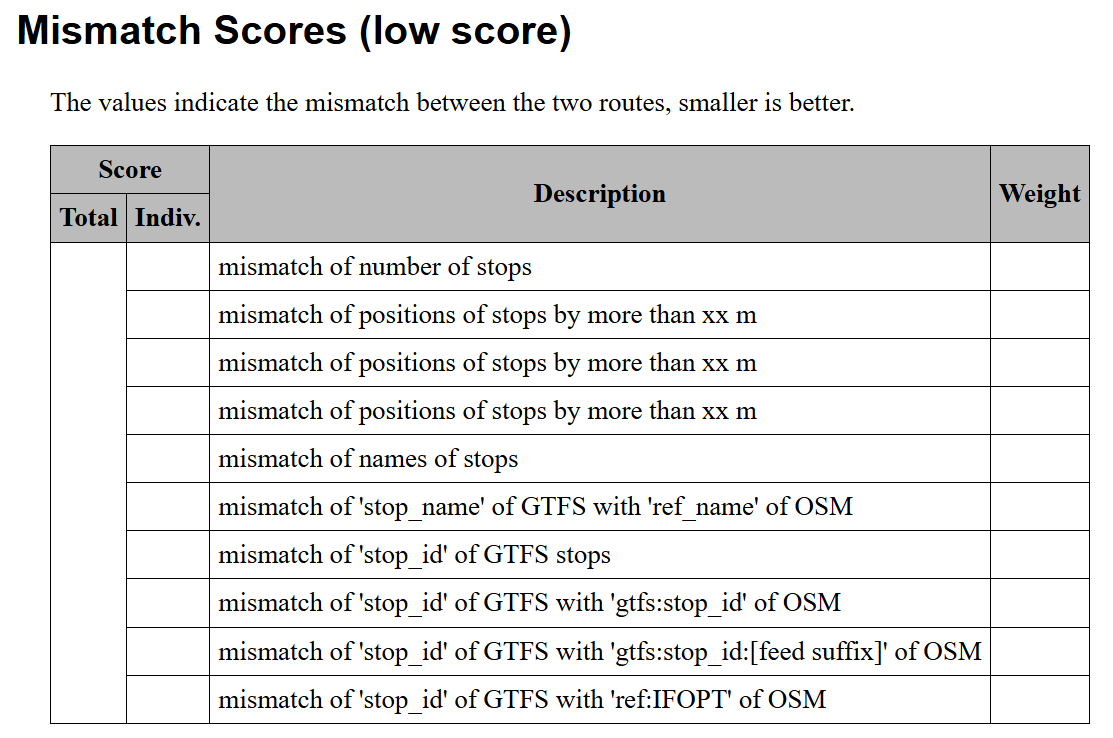
If I then click on a percentage in the comparison table, I get a detailed comparison for the corresponding route. But the mismatch scores in the right-hand table are completely empty. Is this intentional? If so, how am I supposed to know what I should improve?
Addition:
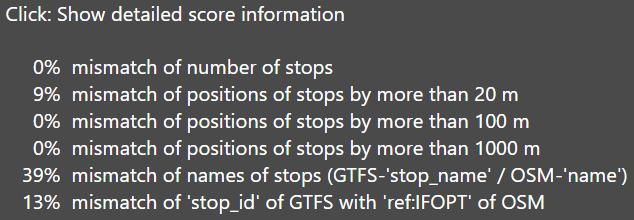
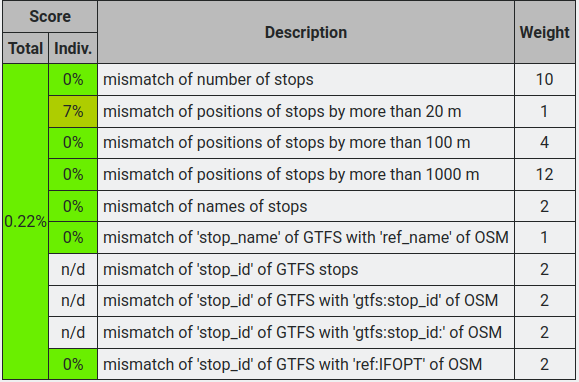
I found out that a few details about the rating are displayed in the tooltip when hovering over the cell. But how do I get the details of which specific stops count towards the 39% stops with a mismatch in name?
As always: documentation is not my favourite. But I’m preparing a presentation for the FOSSGIS 2025 conference end of March in Münster, NRW, Germany. PDF and Slides will be translated to English later on.
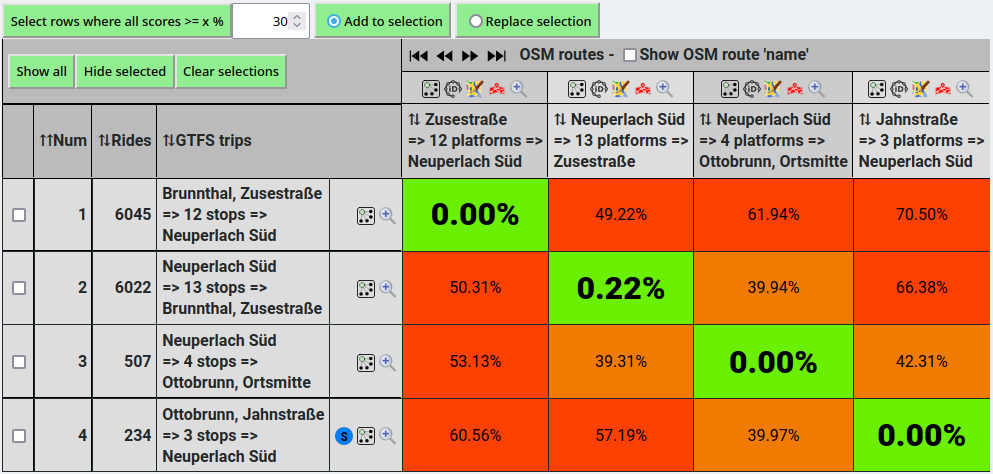
Just a small thing, but I was wondering about the three red cells marked in the screenshot, which can’t possibly match the route. If the GTFS ID can be correctly assigned, you could save the other columns to create a better overview.
I decided not to hide columns because columns represent OSM routes. They actually do exist and should be visible here or be deleted in OSM? “Hide colums where all cells have a score > xx%” would not help here anyway.
You can scroll horizontally cell-by-cell using , quite usefull if you have e.g. 28 GTFS trips and OSM route variants. There are also still the browser’s scroll bars, if the table does not fit horizontally and/or vertically
This page simply shows a comparison of ‘m’ GTFS trips with ‘n’ OSM routes in a static table. There are no assumptions on whether they match at all (compare GTFS’ bus 210 with OSM’s bus 221) and no evaluations on their actual match, just the scores and colours and the mappers can/must decide how to proceed.
BTW: the plans are : include the score calculations also into the PTNA report
if a relation has e.g. “gtfs:trip_id:sample” set and/or
present the single score
based on the GTFS information in the CSV data
quite performance critical to make m x n calculations for m GTFS trips and n OSM routes
I don’t know yet how to present the set of score results for each OSM route then (this route has the best match with GTFS trip ‘y’?)
The values will then be presented in the ‘Notes’ (‘Anmerkungen’) column of the report. But that means: rewrite the JavaScript code in Perl
based on a PM by @mga_geo (sorry, it took some days to handle their “calendar.txt” and “calendar_dates.txt” setup: both have some entries but with disjunctive data sets)
I might have missed it but I find an option to hide OSM relations but is there the same option to hide some GTFS trips? I have routes with far more than 28 variants and I’d like to hide the rows and colons with (almost) matches to focus on the ones with possible errors or changes.
It’s the other way round: You can hide GTFS-trips (rows) but not OSM-routes (columns).
You can scroll horizontally with the double arrows pointing to the right, so that the left-most OSM-route disappears.
There will be no way to hide a single cell, I could only remove the contents of a cell.
It requires shapely from pip, everything else is vanilla Python.
Here’s what I landed on:
The wiki pages will have templates that look like this:
#
# This data is input for the tool: PTNA - Public Transport Network Analysis (https://ptna.openstreetmap.de)
#
# ...
#
################################
#


= Overview of the public transport in מחוז תל אביב, נפת תל אביב / Tel-Aviv Subdistrict, Tel-Aviv District

== Train
# train data in GTFS is unusable, so this must be maintained manually
Blue;train;;Jerusalem Malha;Tel Aviv Center Savidor;Israel Railways
Darkblue;train;;Hod HaSharon Sokolov;Rishon LeTsiyyon HaRishonim;Israel Railways
Darkgreen;train;;Beer Sheva;Nahariyya;Israel Railways
Lightgreen;train;;Modiin;Nahariyya;Israel Railways
-

== Light Rail
@LIGHTRAIL
-

== Bus
@BUS
-
My script will replace @LIGHTRAIL and @BUS with the appropriate CSV data. (You reserved @, +, ~, $ for later use, thanks for that!)
Where geojson is a .geojson file defining the area to be analyzed template is a file containing the template, as downloaded from the wiki gtfs_dir is a directory containing unzipped GTFS files
and outfile is obviously where the output goes (the script just prints to stdout)
It currently spams quite a lot of verbose debugging nonsense to stderr, but this is easy to get rid of.
I can still make changes to the code of course, so for example if geojson is inconvenient for any reason we can switch to a different format or use a different geometry library.