I created a proof-of-concept vector tile server with minutely updates for all zoom levels. All tiles come directly out of a PostgreSQL/PostGIS database which is updated using osm2pgsql. Tiles are not cached so that we can see how fast this setup is already without caching, for a real production server, we’d still need some level of tile caching of course. This runs on an 8 core Hetzner server with 128 GB RAM, initial import took about 20 hours including generation of tables for generalized data. Everything except low/mid-zoom road layers and ocean data is updated from minutely.
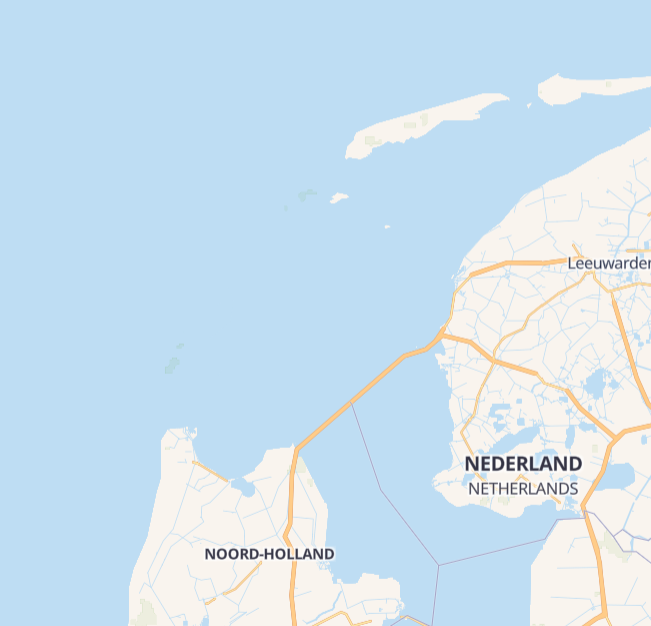
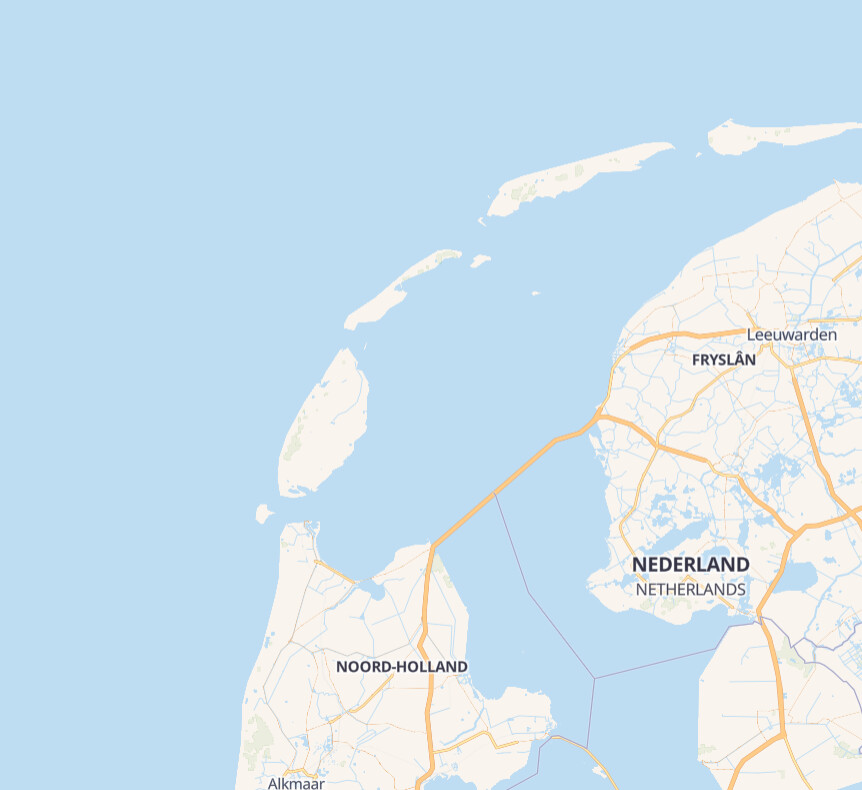
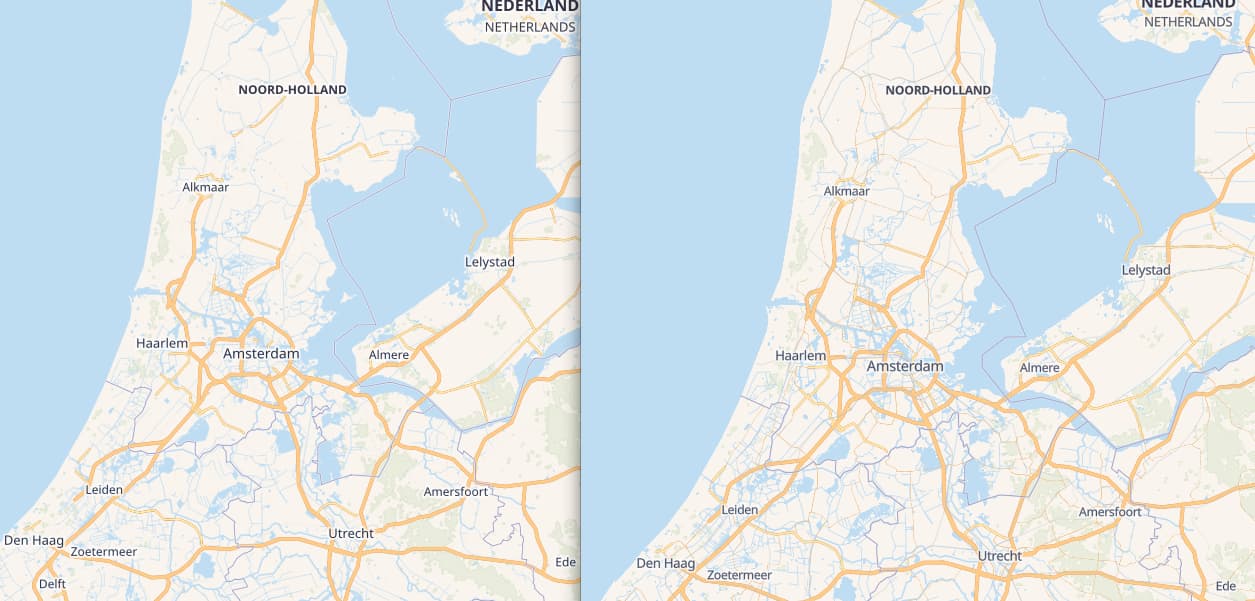
Pretty good proof of concept. Looks very promising. I did however notice that for some reason 2 of the Dutch Wadden Islands seem to dissapear between zoom level 7 and 8, while all the others are fine. https://dev.jochentopf.com/projects/map/#7.88/53.207/5.285
PS: This map already allowed me to fix an issue where someone added the tag natural=bare_rock to the MP of a very large island. Something that was barely noticable on Carto at low zoom levels.
@Taya_S Not sure what’s happening there. The data is there and in all cases the problem seems to be only in a single zoom level, everything above and below is okay, so it doesn’t seem to be related to either data or style file. There is also a bad problem with the coast of Thailand which similarly only happens on a single zoom level. My suspicion is that it is some bug in the tile server (T-Rex) which had similar problems in the past. T-Rex is not developed further any more, so I have to switch at some point anyway, just didn’t have the time to look into other options yet.
@Mateusz_Konieczny As I said, this is a proof-of-concept. There is plenty wrong with the details. Getting the right amount of simplification is a careful balance between keeping tiles small and still making them look good - for each zoom level.
I just want to say thanks for putting this proof of concept together! Talking about technology is one thing, but showing working software that people can touch and use shows everyone what’s possible. Of course there will be little bugs and things to tweak. The important thing here is that it’s a working implementation of minutely vector rendering that we can improve and iterate upon.
You may need to use a tile server that uses ST_AsMVTGeom (t-rex doesn’t) and not touch, scale or simplify the encoded geometries afterwards, since ST_AsMVTGeom will hit the wagyu code path and guarantee the output is OGC Simple and Valid and thus be tessellated correctly by earcut.
Usually if there’s disappearing polygons in MapLibre the feature is still there, just slightly self-intersecting, and can be displayed correctly using more lenient rendering methods like SVG or Canvas.
Great work! A long way to go too! The promise with vector tiles: I, the user, can select the entities that I am interested in and at which zoom level they appear. With pre-rendered tiles, the provider sets the preferences. I learned to live with this.
The future: When I travel to Florence, I want to see all the museums at a zoom that covers all of the greater city. When I trail-run, I want to see all the drinking water sources in my vicinity. When I use my car to get to a place to walk my dog somewhere where excrement boxes abound at a zoom covering 1h drive (purely hypthothetic example, neither own a dog nor a car, but that stuff gets mapped, so there seems to be interest in it) and so on.
As of this demo, I cannot do that. When all the filtering (and merging of what is the same) is done client side, will the vector tiles get huge? Somehow someone has to decide what is available?
Minutely updates appeal to mappers mostly. Server side filtering that keeps tiles small could be most efficiently supported by specialized providers. A thriving ecosystem on the horizon?
Yes this is what the schemas do (the original MapBox one, OMT and shortbread Shortbread). You are very unlikely to be able to get all data at all zoom levels from any schema, you could naturally systematically under zoom, but that will be expensive.
I am impressed, by the update cycle, by the vector rendering, by your toolchain. For a while I am hoping, OSM will offer a vector tile server. Seeing your project, that would not be magic. And a OSM homepage map using vector rendering also!
Next I was curious if your proof-of-concept would fit for 3D rendering too. Of course not. Much more tagging is needed. May be some extra zoom levels 16/18/20 with less restrictive schemata are needed to cover ALL OSM-data and cover all possible purposes of rendering; but NOT needed to update minutely. An “update on request” may be useful for i.e. 3D editing. Shortbread needs to be extended a lot, doesn’t it? But if the idea is there, a way will be found.
In the browser log I read “mapbox” but I see it is using maplibre, great!
You use zoom 1 to 14. I wonder if really all are needed. For vector rendering only the even zooms may do it and zoom isn’t integer anyway.
Is the map linked from topic top post using Shortbread? I see tracks and footways/cycleways/paths there just fine.
PS: This is not a wishlist for the display, still - 1) Motorway links should render at the same zoom as primaries, otherwise there are bad gaps in the low zooms, important for highlevel traffic infrastructure. 2) Curiously, zoom level 17 in the vector map on screen shows the same size as zoom level 18 in OSM-Carto - is this with all vector maps?
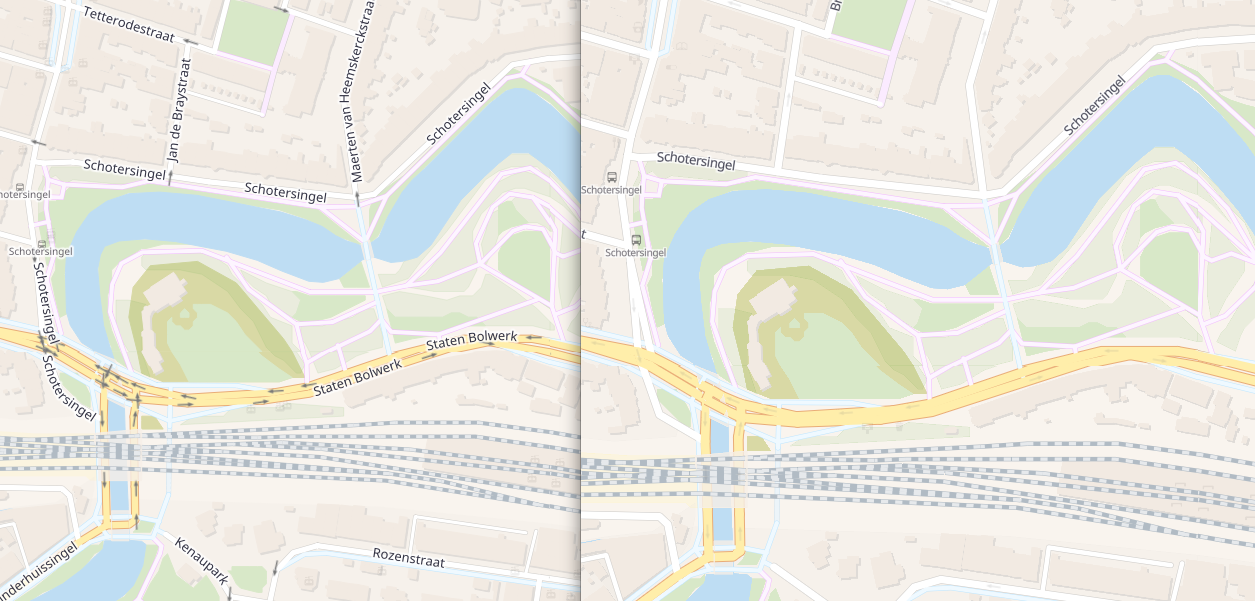
The visibility of a road at a particular zoom level is controlled by a combination of server-side filtering by the vector tile generator and client-side filtering by the style. Ideally, any link way would be filtered out as long as one of the roads it connects is filtered out, to avoid a barbed wire effect:
This is true of any map rendered by Mapbox GL or MapLibre GL, even (by default) when those libraries show a raster tileset, such as an imagery layer. However, a map that uses OpenLayers or Leaflet (via the mapbox-gl-leaflet or maplibre-gl-leaflet plugin) would display content at viewports consistent with the zoom levels you’re familiar with on osm.org.