You need to link (or build) a style-JSON like https://pnorman.github.io/tilekiln-shortbread-demo/colorful.json instead of the linked tile-JSON.
This includes the needed properties.
Text in Thai is not rendered. Here’s the example: https://pnorman.github.io/tilekiln-shortbread-demo/#16.33/13.726255/100.512362
Those with Thai characters are rendered blank.
I still want to fix it properly, but I turned on compression on the CDN as it was an easy change.
I have turned on gzip and brotli compression and am very curious if this reveals any buggy clients. I am confident gzip is fine - it’s widely used by clients - but there might be clients that claim to support br but have never tested it. I would be worried about turning it on with an existing service, but as I don’t have to worry about a large existing userbase that’s not an issue.
I’ve checked and the data is in the tiles, so it’s a style issue. Maplibre has problems with some character sets, but Thai is not one of them.
1 Like
I’ve gone through and made a list of feedback and actions taken or a link to a ticket covering the issue.
| Issue | Type | Status | Cause | Issue link |
|---|---|---|---|---|
| CORS header errors | Bug | Resolved | Unknown - error went away before I saw it. | |
| Seeing what changeset updated the tile most recently | Enhancement | Rejected | Not possible, and we’re not attempting to replicate OWL | |
| Seeing the timestamp of when a tile was updated | Enhancement | Accepted | Sending proper headers for caching was planned | Store and send age of tiles · Issue #39 · pnorman/tilekiln · GitHub |
| Broken road rendering at tile edges | Bug | Accepted | Insufficent buffer | Increase buffers on linear features · Issue #34 · pnorman/spirit · GitHub |
| Changes not rendering after 2 hours | Bug | Not reproduced | Unknown, error had gone away when I looked. Possibly a caching issue with the demo setup. | |
| Curved lines rendering jagged | Bug | Accepted | Quantization of coordinates leads to issues with heavily-noded ways | Rendering artifacts on highly-noded ways from quantization · Issue #36 · pnorman/spirit · GitHub |
| Railways and service roads not rendered | Bug | Rejected | Upstream style issue | Service rails not shown with colorful · Issue #15 · versatiles-org/versatiles-style · GitHub |
| Add name to water polygons | Bug | Rejected | There are already label points and it is not possible to label a polygon with vector tiles | |
| streets_polygons_labels | Bug | Accepted | Noted as TODO | Add streets_polygons_labels layer · Issue #37 · pnorman/spirit · GitHub |
| Results look blocky at high overzoom of low zoom tiles | Bug | Rejected | Overzooming this much is expected to result graphical issues. The specific issues are likely to change with simplification work | |
| Vector tiles are too large, particularly at low zoom | Enhancement | Accepted | A first pass at tile size reduction needs to be done | Reduce low-zoom tile size · Issue #38 · pnorman/spirit · GitHub |
| Vector tiles are uncompressed | Enhancement | Accepted | Compression needs doing properly, but is turned on on the CDN for now. | Minutely updated vector tiles demo - #43 by pnorman |
| No barriers in tiles | Enhancement | Rejected | Issue raised upstream with shortbread | Feature request: Barriers layer(s) · Issue #39 · shortbread-tiles/shortbread-docs · GitHub |
| Text in thai is not rendered | Bug | Rejected | Upstream style issue |
10 Likes
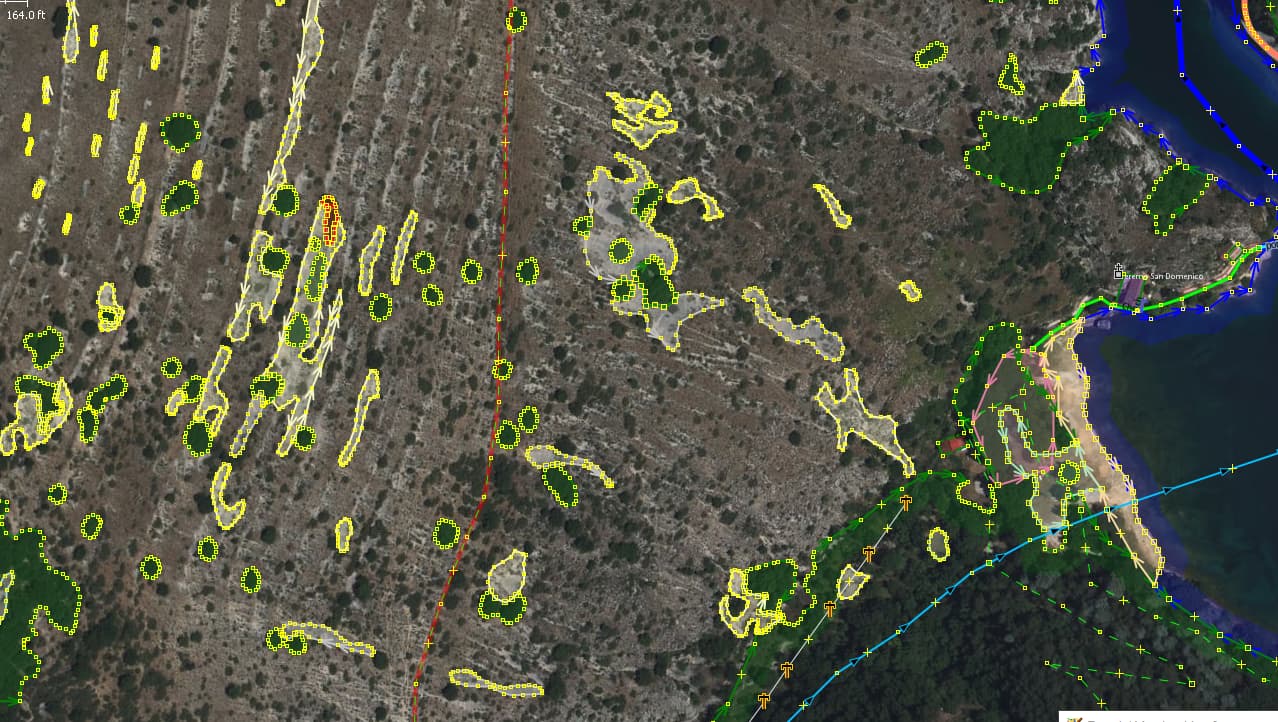
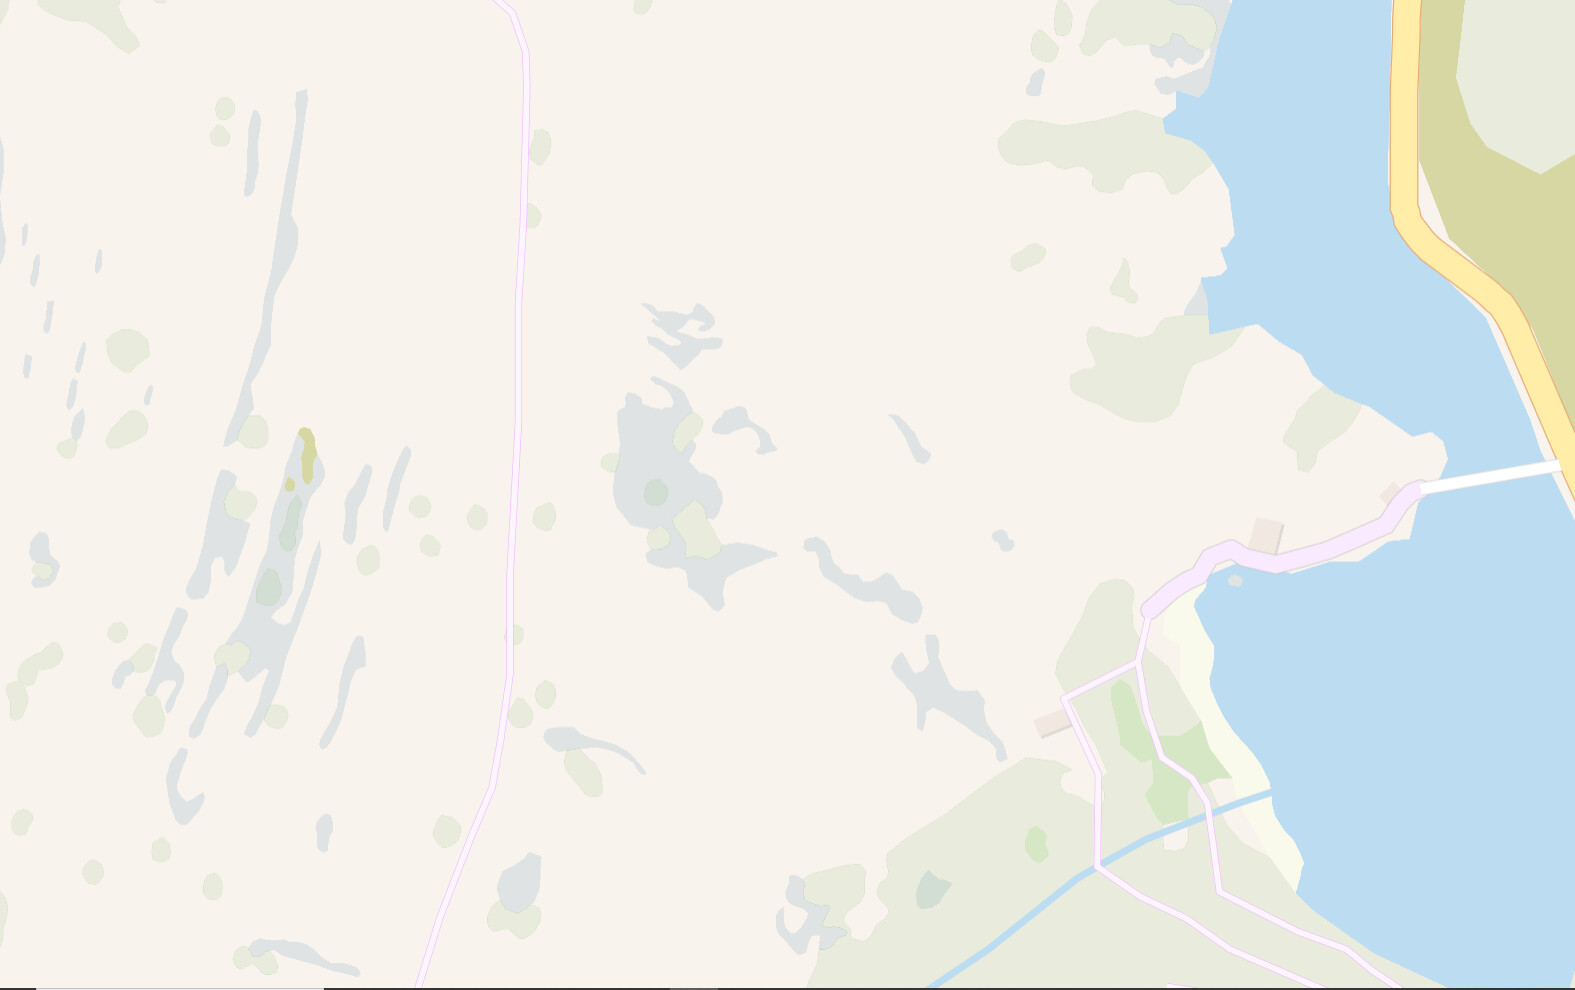
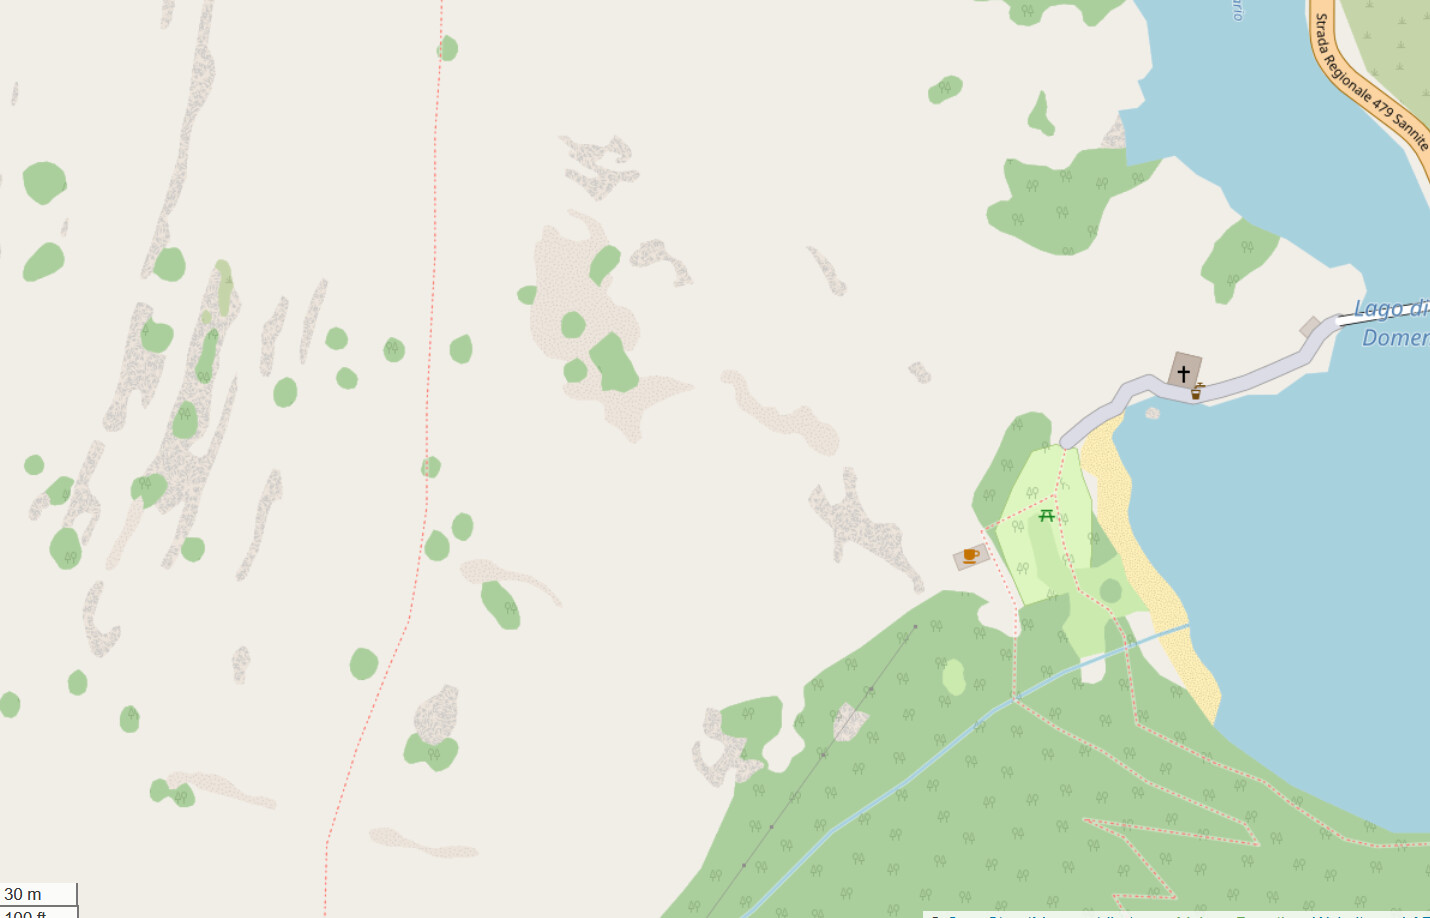
Took a look this morning how minutely the map appears and it did swiftly ![]() , large set uploaded and comparing to what is seen, notice powerline/poles not showing, a small beach on the lake edge (navigated to the coast to check but shows same as residential), scree+bare rock render identical, picnic site missing, no indication of place of worship, and what I was hoping for, natural grasslands (prateria as it’s called here) in a duller rendition of which there’s a lot here appearing same as agricultural pasture, speak meadow, which is much brighter in real live. Anyway, this is the zone mapped yesterday afternoon and this morning per JOSM, per ‘colorful’, and per Carto standard after about 5x Ctrl+F5 at 30m zoom
, large set uploaded and comparing to what is seen, notice powerline/poles not showing, a small beach on the lake edge (navigated to the coast to check but shows same as residential), scree+bare rock render identical, picnic site missing, no indication of place of worship, and what I was hoping for, natural grasslands (prateria as it’s called here) in a duller rendition of which there’s a lot here appearing same as agricultural pasture, speak meadow, which is much brighter in real live. Anyway, this is the zone mapped yesterday afternoon and this morning per JOSM, per ‘colorful’, and per Carto standard after about 5x Ctrl+F5 at 30m zoom
1 Like
This is absolutely stellar work (of you and of everyone involved with vector tiles development) and I can’t wait to see minutely-updated vector tiles on the OSM home page. This would show so much better what OSM is capable of, especially if users can modify the map on the fly with overlays, custom styles, label languages, et cetera.
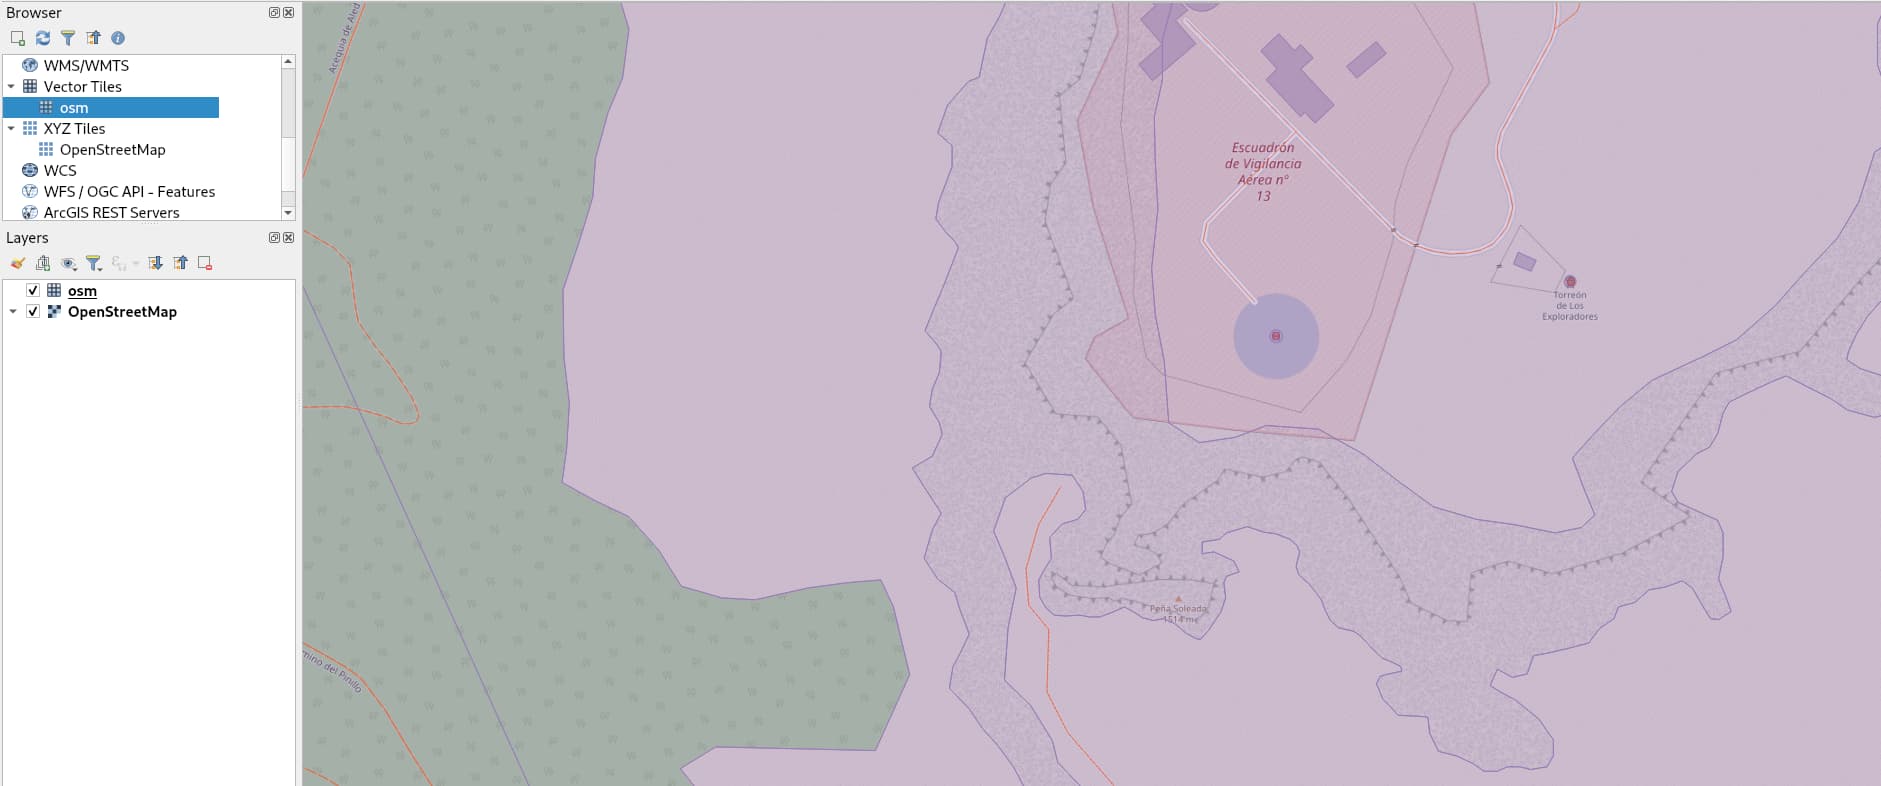
I have one specific concern though. On high zoom levels coordinates are rounded very noticeably. This causes various artifacts. One was brought up above (highly-noded roads) but there are other situations without such a large node count where this happens. For example, the zig-zag in the middle of this picture (z18, with osm-carto z19 for comparison):
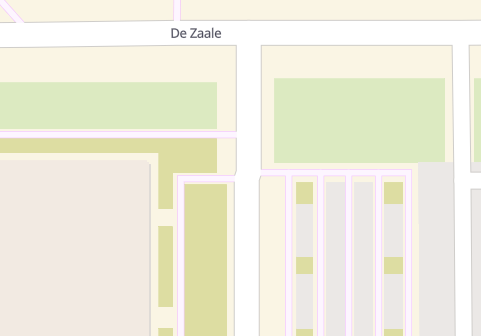
This would be annoying for me when using vector tiles as a mapper feedback style. After mapping an area, I often check the OSM main layer to double-check that straight roads are drawn straight, things are aligned, and so on. With these artifacts present, I don’t know if the issue is caused by the coordinate rounding, or by me messing up when trying to draw a straight line (happens often too ![]() )
)
TL;DR: Would it be possible to not noticeably round coordinates in high zoom levels?
3 Likes
The server is currently stopped while I perform updates that require a DB reload and resetting the tile store.
The changes are really all behind the scenes for this one, there should be no visual impact.
The big change is the last time a tile was changed is now stored in the tile store. This is the last time changed, not generated, so if it is regenerated and byte-for-byte identical the time doesn’t get updated.
This allows last-modified and etag HTTP headers which will improve caching. As a very useful side-effect it will allow you to look at a tile and see approximately when the edits that caused the changes were made. Because it only updates the date when the contents have changed it is more specific than the last changes which caused it to be regenerated.
An online web tool could be made that exposes this information, but that’s not part of my project.
There’s also some changes on the tile definition side, but I don’t think anyone will notice them.
9 Likes
Great, will the improvements to caching stop the issue of new mappers wondering why their changes aren’t showing and then they have to learn how to clear their browser cache?
New mappers aren’t using this service at this time - at least, I would assume not given it’s only linked to from here!
tile.osm.org doesn’t require clearing the browser cache, but a discussion of that belongs in a different thread.
I would like to ask another question about the Vectortiles (https://demo.tilekiln.xyz/shortbread_v1/{z}/{x}/{y}.mvt). I have recently added a stone arch (Node: Arco Sigismondi (11657976984) | OpenStreetMap). I can’t find it in the tiles tonight. I can find a path ( Way: 1254168043 | OpenStreetMap) that I added in the same changeset ( Changeset: 147831703 | OpenStreetMap).
Is it the case that not all points are being included to https://demo.tilekiln.xyz/shortbread_v1/{z}/{x}/{y}.mvt or am I doing something wrong?
natural=arch is not included in the Shortbread schema:
3 Likes
I wanted to create vector styles for QA purposes: color coding e.g. buildings by types or roads by max speed. But I quickly found out that the tags that would be needed for that are not included in the Shortbread schema.
Is there any chance to include such tags in the schema? Or would they be out of scope? Is there a schema that includes “everything” and as many tags as possible?
I hope not.
Adding information that is only useful for a specific use case to the vector tiles would open the flood gates to… basically add any data that has some use case.
If the goal was to add as much information as possible into the vector tiles, they would became somewhat useless as its size would grow to be enormous.
(The demo tiles in shortbread scheme are currently already are 15x times the size of a commercial provider of vector tiles but I am sure this is going to be improved)
The correct approach with showing specific data additionally to a base map is to add a second (, a third, a fourth, …) vector tile source to your style which each provides the data you need.
Now, how to get this data? For testing small data sets, you can have a simple geojson as a source. For world-covering data like speed limits, you need some setup that creates vector tiles and host them yourself.
I think the method that requires the least setup effort is PMTiles (because in the end, it is just a big file you can put on a webspace, no server software required). To be honest though, I didn’t dwelve into that really, so my knowledge about that is very limited. But in case you are interested to know more, maybe @tordans wold be able to provide a few pointers.
PMTiles is great. Strong recommend to anyone interested.
To the point made by @hfs, leaving all the “extra” tags on TIGERMap means the filter function is quite simple but powerful and intriguing. I have been tempted to try and stand up a full data PMTile map for a smaller region (say, all of Washington State) and update that daily.
A more “whole” QA focused approach definitely can’t be updated minutely and low zooms probably look like nonsense but there’s definitely something interesting about it.
Perhaps this needs it’s own thread so we aren’t in the middle of this specific effort.
2 Likes
I hope someone will have the time to write more about this, soon, to manage expectations. The way I see it, this project here will create a basemap vector tiles setup. This will have to be optimized to be a great, maintainable basemap. Part of this will have to be to minimize data and make decision to have a great performance and visual style. The vector data that will result in this, will be optimized for this use case only.
But then there are all our other usecases, like showing specific tags, showing high details of data, showing debugging information like in your use case. Alle those need to be add-on community projects. In fact, they would be possible today, already. It is just, that we don’t have to improve our collective know how and tooling. More to the point, you can take a pixel or vector basemap today and create your debugging vector tiles to show on top of them. In fact, that is what we do with Radverkehrsatlas-de (here a view of processed maxspeed data).
So what will this project give us for those use cases? Directly only little, but in directly a lot. We will have more tooling and more shared knowledge about how to create, visualize and manage vector tiles. Especially with the ability to update them very frequently.
Back to your use case to show building or maxspeed data: There are a lot of ways to do this today, depending on the details of your usecase. If you want the data of a smaller region, I would go for it like this: (a) create a geojson of the osm data and modify it in the way to want to show it, reduce it as much as possible; (b) use GitHub - felt/tippecanoe: Build vector tilesets from large collections of GeoJSON features. to create a pmtile out of it, put that on an S3 bucket or some other webserver; (c) create a small webpage using maplibre and use the vector tiles from this project as basemap (or any other basemap, can be pixels as well); (d) add your custom Pmtiles source and add a style (PMTiles for MapLibre GL | Protomaps Docs) — Now you have a custom map.
An example: Our recently launched cycling quality index does follow those steps Cycling Quality Index Map (BETA-Version) (there are Forks that remove some of the non-needed code).
In case your usecase is more of “have data for a whole country or world”, you would likely have to look into one of the tools that transform a planet dump or into osm2pgsql. All of which are a lot more complex. (Leading back to the part where we need to build up more know how on how to do such things as a community.)
3 Likes
I have pushed a set of changes that should address the issues with coordinate rounding causing jagged edges in roads as well as significantly help tile size. The tiles I was testing on are less than half the size of before and I expect to see similar reductions in other large tiles.
Tiles might be slower for a bit because I wiped out all the stored tiles and everything has to regenerate.
9 Likes
I noticed today that there’s some sort of strange issue with the northeastern US & Atlantic Canada right now at certain zooms (link)

I’m on mobile, so I’m unable to determine if this is an issue with the underlying OSM data like a broken coastline, or something from the vector tiles.
Took a few seconds after showing your initial picture, but it filled out correct, suppose the noted tile refresh needed more time.