In general, I think the better approach with vector maps (on OpenStreetMap) is to have
a. one base map that only shows the common things you’d expect on any map and then
b. have special overlays for various data that are shown on top of that base map and highlight the given data, e.g. metro and public transport network, bicycle infrastructure, max speeds, hiking routes, building types / 3d buildings, power infrastructure, POIs (shops etc.), …
Point b could be implemented by pre-crafted overpass queries with coloring applied or additional vector layer sources.
This approach has several benefits:
maintainers of the then-official openstreetmap vector map style are not under pressure to perform the balancing act between creating a style that shows as much as possible to demo to the world the detailedness of OpenStreetMap data and a style that is actually clear, not overfraught with details, to end users. This produced a fair bit of contention in the past with osm carto
The default OpenStreetMap map will look better (clearer, less busy) for normies
If the overlays-button is not too hidden and overlays are still pretty and linkable, normies can still use and enjoy the OpenStreetMap detail by using these
OpenStreetMap contributors will have an easy to reach tools on the website website to view, analyse and maybe debug aspects of the map data that is currently not even visible on osm carto (see examples in point b)
Doh, thanks for pointing out this discrepancy – it’s so easy to forget.
On this note, is openstreetmap-website integration with a vector map currently on the roadmap? Is the plan to migrate to MapLibre like the demo site, or continue to use Leaflet but with a MapLibre compatibility shim?
I still want to fix it properly, but I turned on compression on the CDN as it was an easy change.
I have turned on gzip and brotli compression and am very curious if this reveals any buggy clients. I am confident gzip is fine - it’s widely used by clients - but there might be clients that claim to support br but have never tested it. I would be worried about turning it on with an existing service, but as I don’t have to worry about a large existing userbase that’s not an issue.
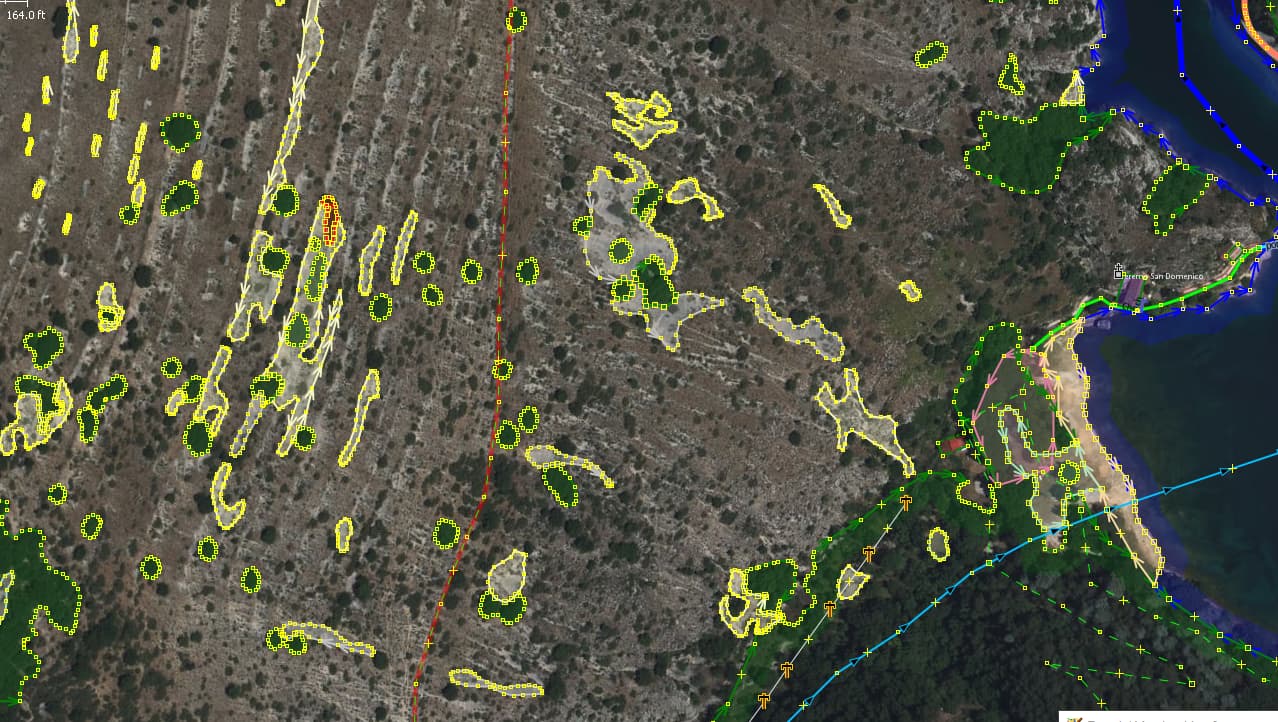
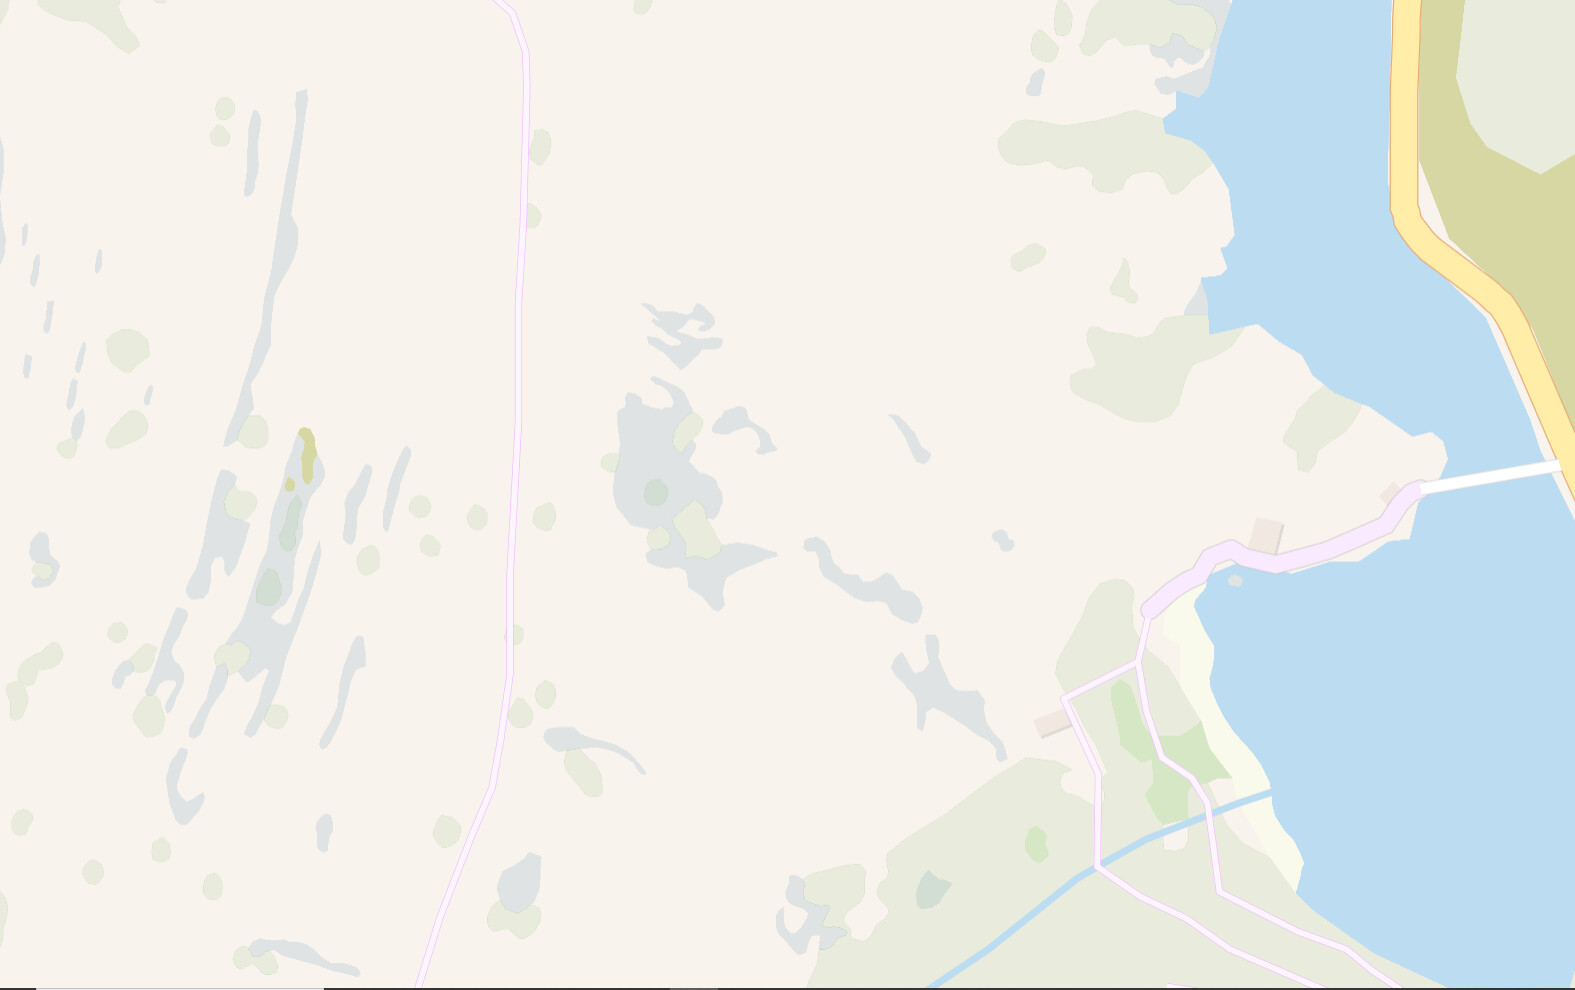
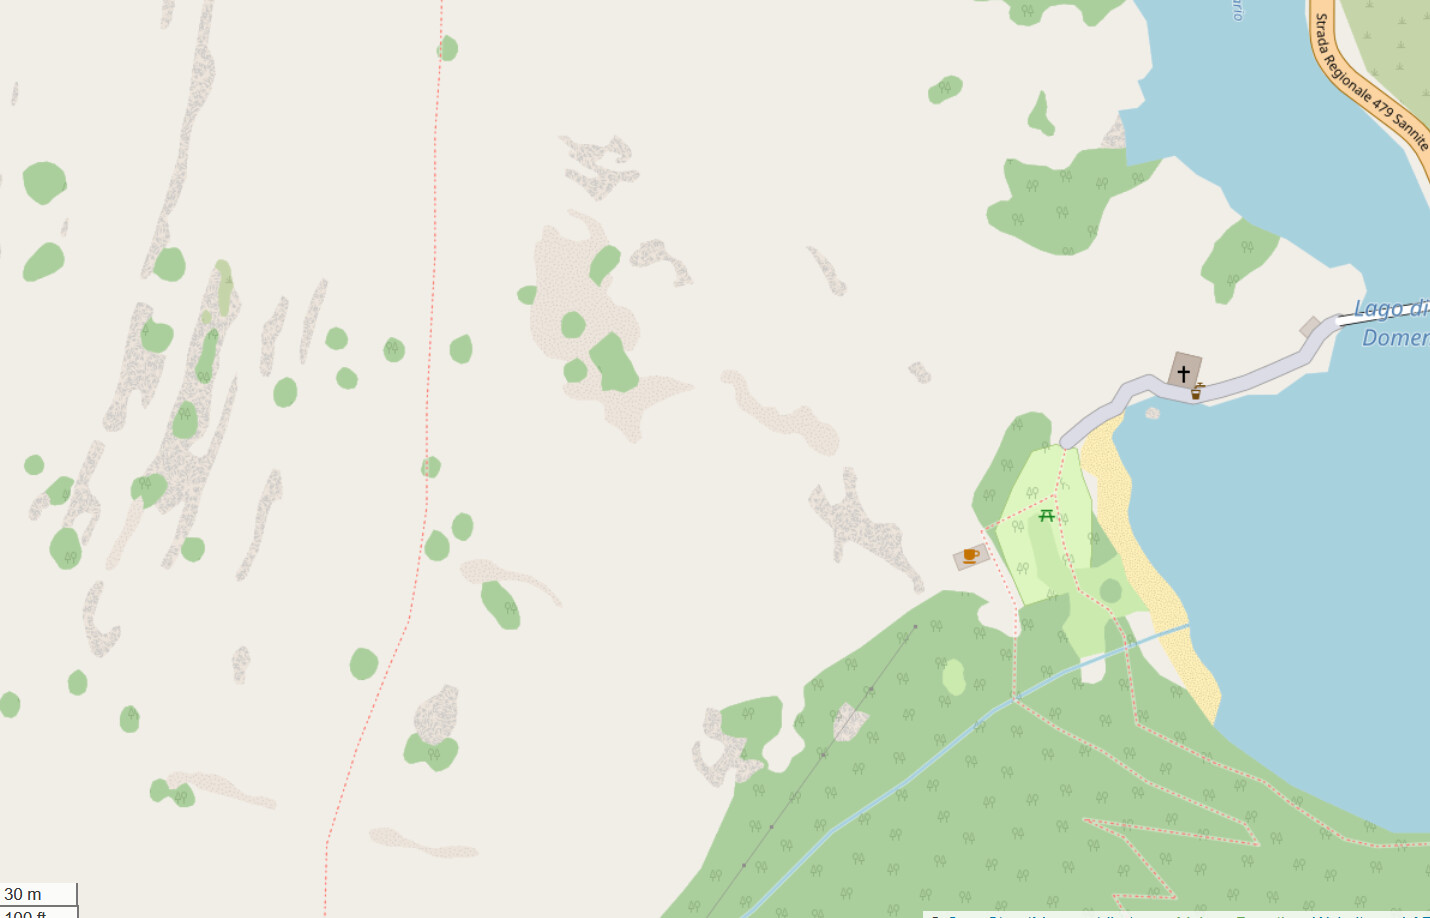
Took a look this morning how minutely the map appears and it did swiftly , large set uploaded and comparing to what is seen, notice powerline/poles not showing, a small beach on the lake edge (navigated to the coast to check but shows same as residential), scree+bare rock render identical, picnic site missing, no indication of place of worship, and what I was hoping for, natural grasslands (prateria as it’s called here) in a duller rendition of which there’s a lot here appearing same as agricultural pasture, speak meadow, which is much brighter in real live. Anyway, this is the zone mapped yesterday afternoon and this morning per JOSM, per ‘colorful’, and per Carto standard after about 5x Ctrl+F5 at 30m zoom
This is absolutely stellar work (of you and of everyone involved with vector tiles development) and I can’t wait to see minutely-updated vector tiles on the OSM home page. This would show so much better what OSM is capable of, especially if users can modify the map on the fly with overlays, custom styles, label languages, et cetera.
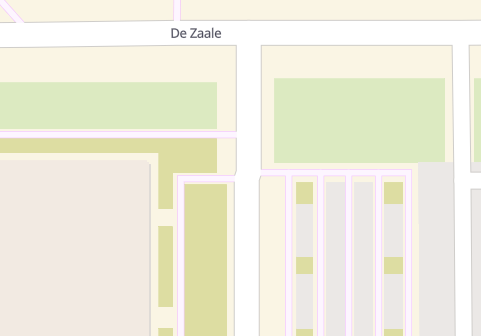
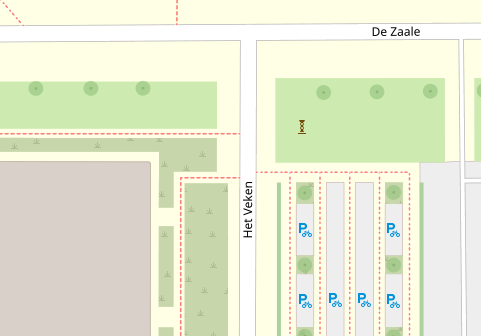
I have one specific concern though. On high zoom levels coordinates are rounded very noticeably. This causes various artifacts. One was brought up above (highly-noded roads) but there are other situations without such a large node count where this happens. For example, the zig-zag in the middle of this picture (z18, with osm-carto z19 for comparison):
This would be annoying for me when using vector tiles as a mapper feedback style. After mapping an area, I often check the OSM main layer to double-check that straight roads are drawn straight, things are aligned, and so on. With these artifacts present, I don’t know if the issue is caused by the coordinate rounding, or by me messing up when trying to draw a straight line (happens often too )
TL;DR: Would it be possible to not noticeably round coordinates in high zoom levels?
The server is currently stopped while I perform updates that require a DB reload and resetting the tile store.
The changes are really all behind the scenes for this one, there should be no visual impact.
The big change is the last time a tile was changed is now stored in the tile store. This is the last time changed, not generated, so if it is regenerated and byte-for-byte identical the time doesn’t get updated.
This allows last-modified and etag HTTP headers which will improve caching. As a very useful side-effect it will allow you to look at a tile and see approximately when the edits that caused the changes were made. Because it only updates the date when the contents have changed it is more specific than the last changes which caused it to be regenerated.
An online web tool could be made that exposes this information, but that’s not part of my project.
There’s also some changes on the tile definition side, but I don’t think anyone will notice them.
Great, will the improvements to caching stop the issue of new mappers wondering why their changes aren’t showing and then they have to learn how to clear their browser cache?
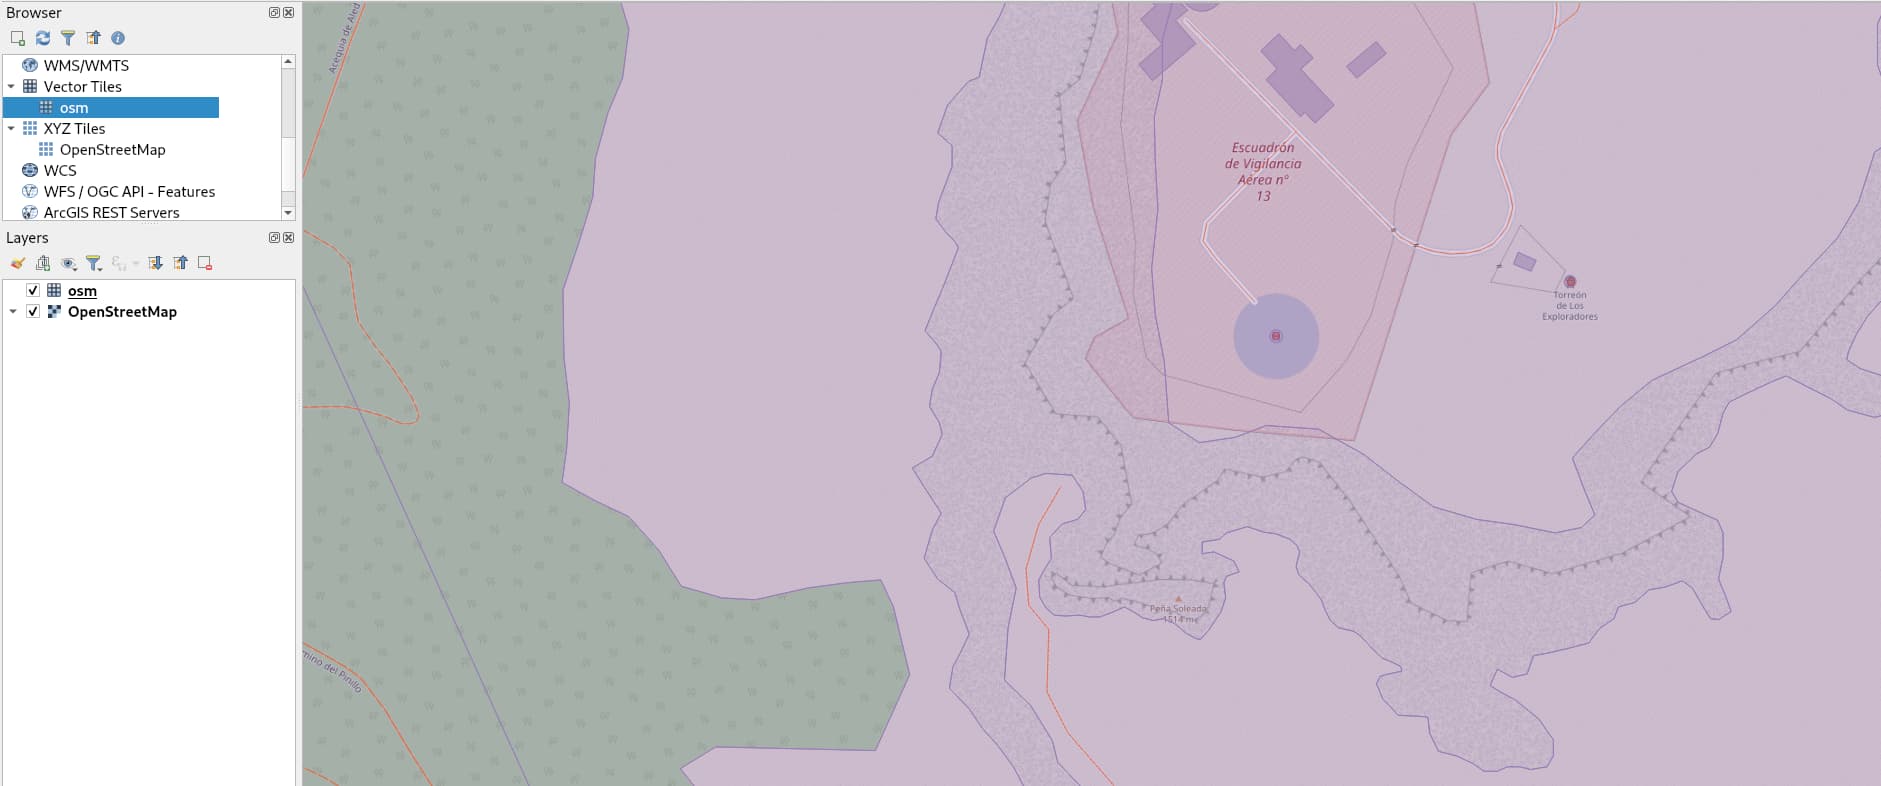
I wanted to create vector styles for QA purposes: color coding e.g. buildings by types or roads by max speed. But I quickly found out that the tags that would be needed for that are not included in the Shortbread schema.
Is there any chance to include such tags in the schema? Or would they be out of scope? Is there a schema that includes “everything” and as many tags as possible?
Adding information that is only useful for a specific use case to the vector tiles would open the flood gates to… basically add any data that has some use case.
If the goal was to add as much information as possible into the vector tiles, they would became somewhat useless as its size would grow to be enormous.
(The demo tiles in shortbread scheme are currently already are 15x times the size of a commercial provider of vector tiles but I am sure this is going to be improved)
The correct approach with showing specific data additionally to a base map is to add a second (, a third, a fourth, …) vector tile source to your style which each provides the data you need.
Now, how to get this data? For testing small data sets, you can have a simple geojson as a source. For world-covering data like speed limits, you need some setup that creates vector tiles and host them yourself.
I think the method that requires the least setup effort is PMTiles (because in the end, it is just a big file you can put on a webspace, no server software required). To be honest though, I didn’t dwelve into that really, so my knowledge about that is very limited. But in case you are interested to know more, maybe @tordans wold be able to provide a few pointers.