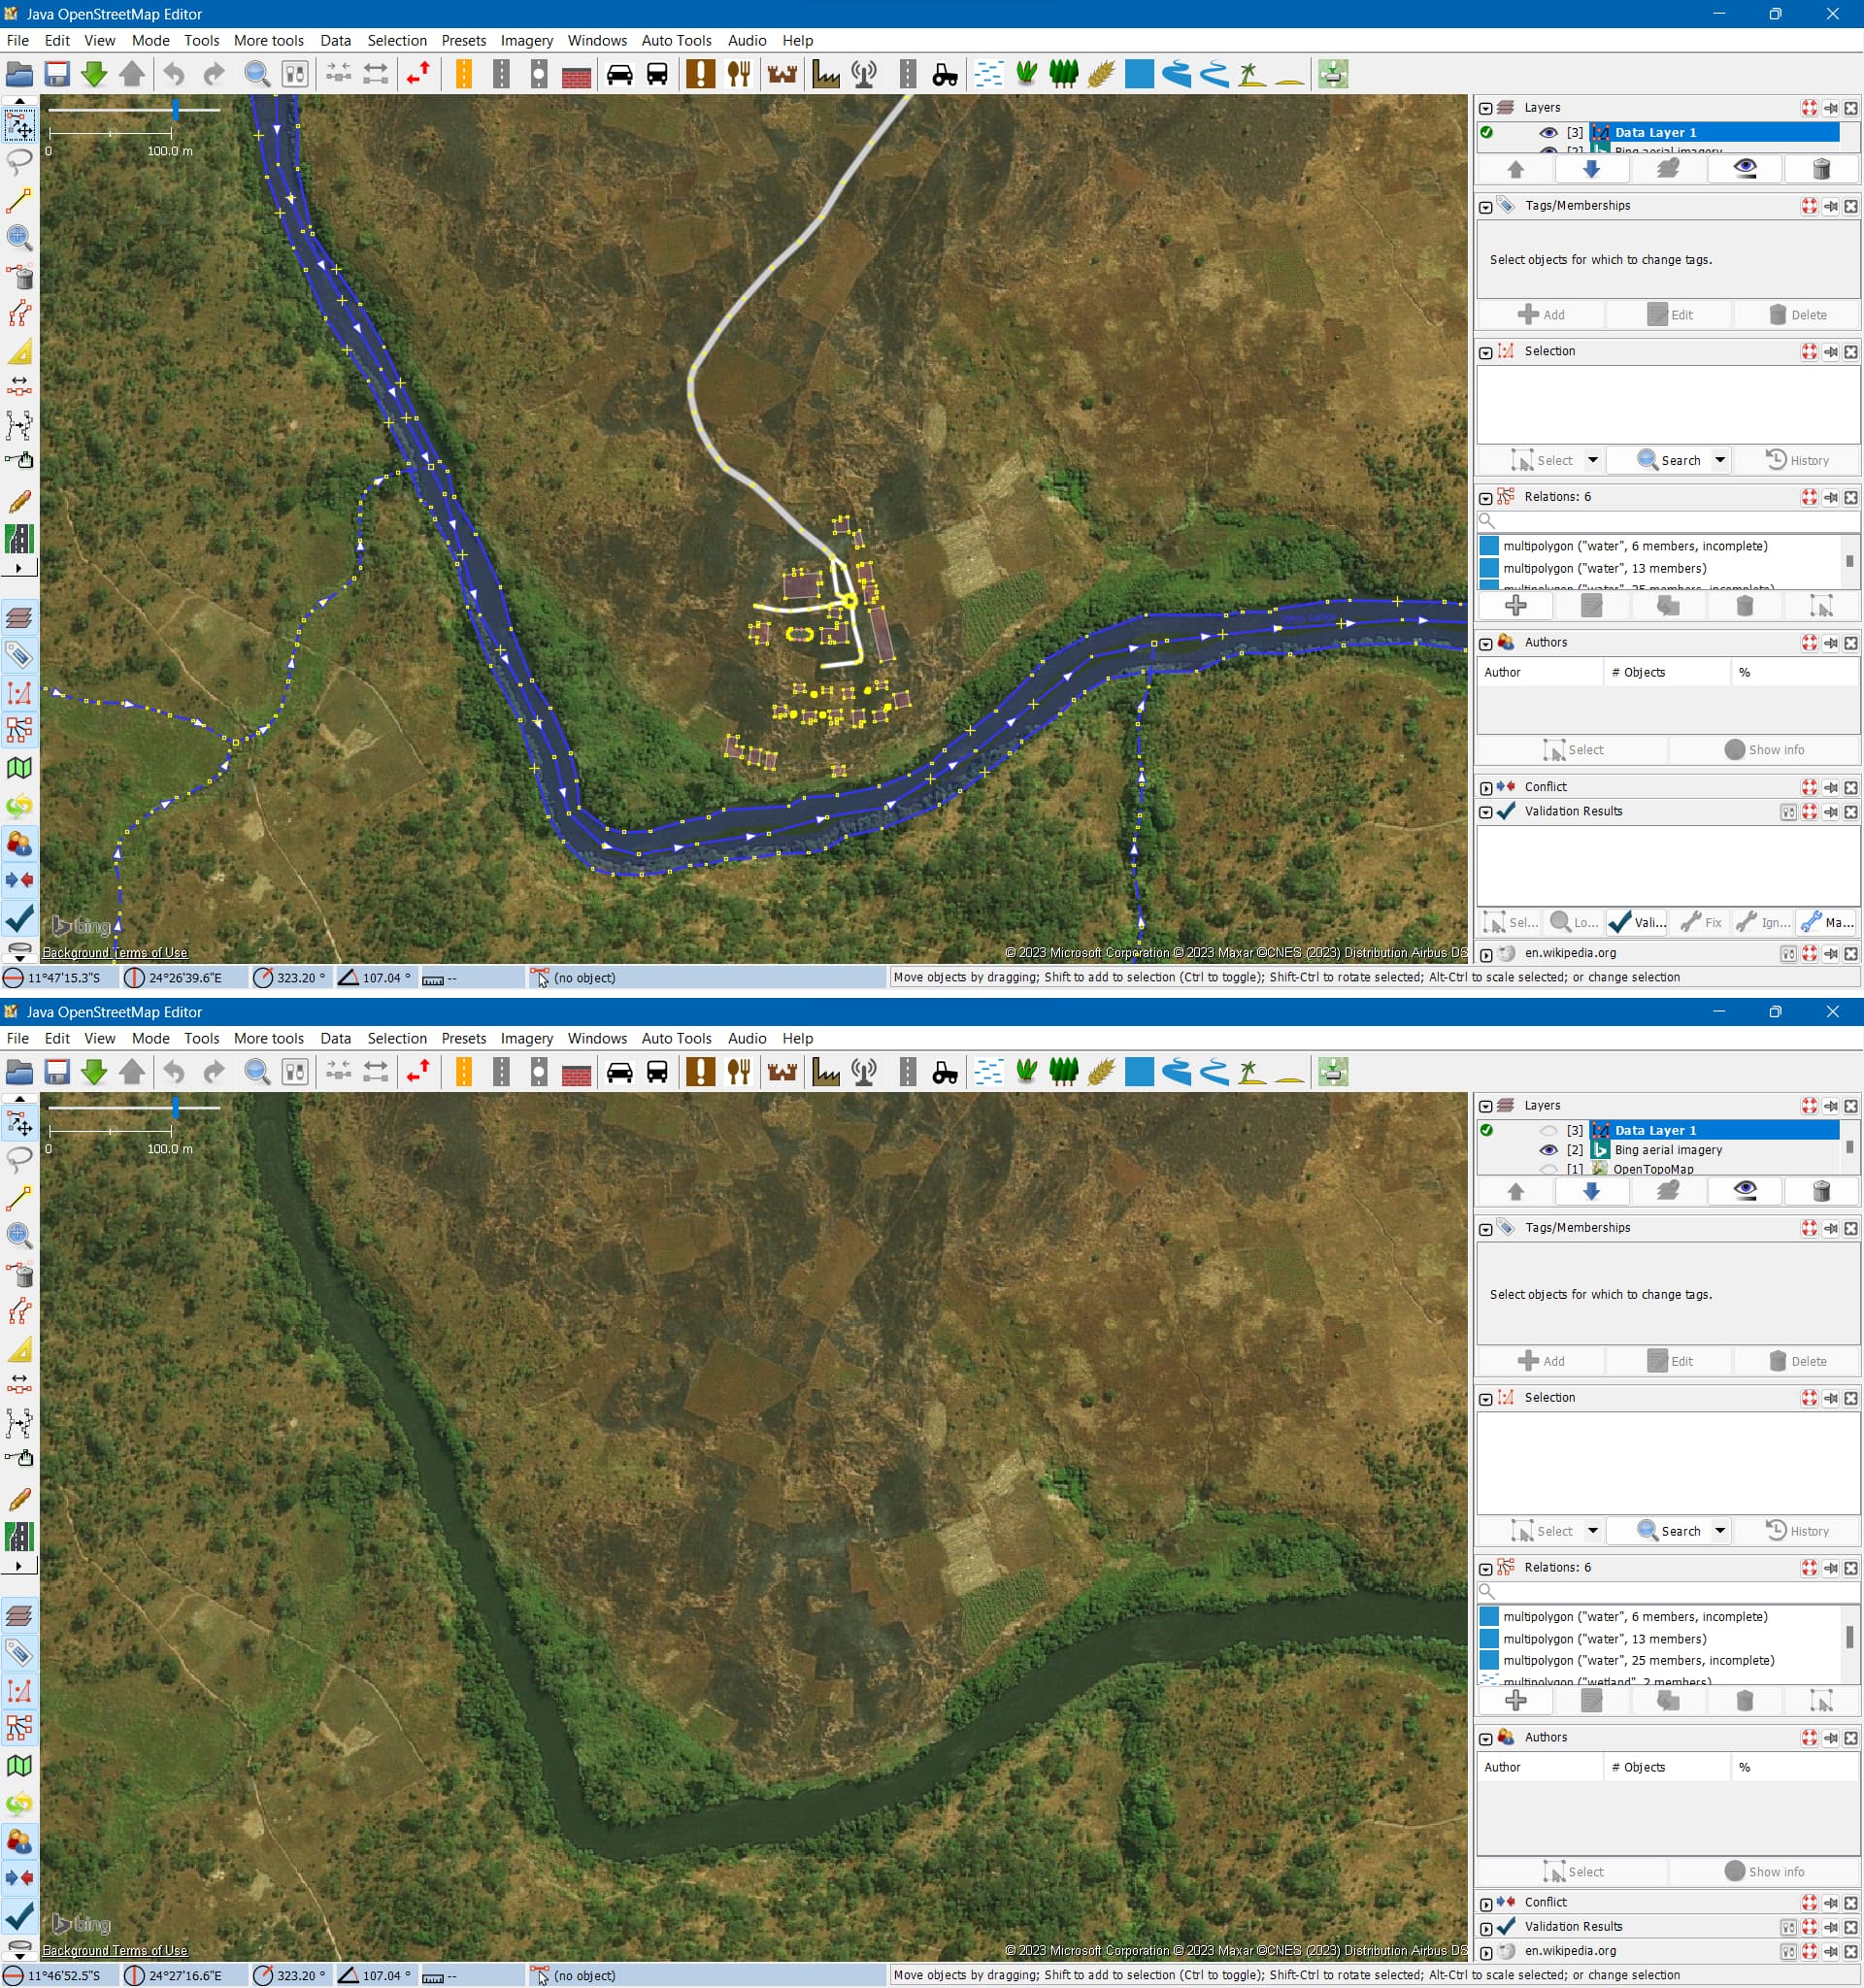
Just one example of how out of date Bing imagery is. This is an area near the town of Mwinilunga in Zambia that is fairly remote. The development that was originally mapped as part of the #hotosm-project-13416#zambia-census in 2022 used Maxar imagery (my thoughts on the effectiveness of this project are for another discussion). A HOT validator with any sense would not remove this but it would not be so obvious where there were buildings mapped in a remote village where a number of new huts and houses were added based on the Maxar imagery that do not appear in Bing imagery. The basis of this project is to map remote human settlements in Zambia, I assume to assist with the census that took place last year.
Building on top of @SomeoneElse and @pnorman’s great work, I have looked at relative percentages instead of absolute numbers over the last year. For example, 19613 changesets in Germany and 15404 in Afghanistan used Maxar, but in Afghanistan, that’s 88% of changesets; in Germany, about 1%.
If you’re mapping in Germany, you probably haven’t noticed that Maxar is gone. If you’re mapping in Afghanistan, well, you’re probably not mapping right now. Like @ftcat has pointed out, there’s a very good reason why 83% of changesets in Zambia over the past year have
used Maxar.
Many of the most affected countries are in the global south, where OpenStreetMap is often the most usable map, sometimes the only usable map. People rely on it for their jobs and daily lives.
The OpenStreetMap Foundation is very much aware of the issue, and is continuing to look for solutions. I have reached out to Maxar, and I will update this thread if/when we hear back.
Country
Maxar count
Total count
Maxar percentage
Guatemala
100412
107552
93,36%
El Salvador
102280
114432
89,38%
Afghanistan
15404
17485
88,10%
Somalia
14745
17620
83,68%
Zambia
60130
72095
83,40%
Timor-Leste
10364
12913
80,26%
Congo (DRC/Kinshasa)
45216
57122
79,16%
Qatar
12379
15759
78,55%
Libya
18980
24256
78,25%
United Arab Emirates
40728
52429
77,68%
Syria
49353
64668
76,32%
Mali
13417
17898
74,96%
Togo
10533
14058
74,93%
Madagascar
24456
33235
73,59%
Ethiopia
16406
22328
73,48%
Tanzania
86890
118618
73,25%
Sudan
14346
19585
73,25%
Malawi
40710
56123
72,54%
Bangladesh
60622
83580
72,53%
Pakistan
17161
26172
65,57%
Turkey
131282
204181
64,30%
Honduras
32385
51313
63,11%
Egypt
16848
28513
59,09%
India
253789
431936
58,76%
Peru
37037
68006
54,46%
Kenya
30045
59749
50,29%
China
58226
116383
50,03%
Nepal
31692
63876
49,61%
Malaysia
27224
57220
47,58%
Indonesia
138214
293674
47,06%
Nigeria
55355
118617
46,67%
Saudi Arabia
17270
39509
43,71%
Viet Nam
20203
49958
40,44%
Iraq
15819
39679
39,87%
Philippines
46432
117337
39,57%
Mexico
33012
85477
38,62%
Kazakhstan
18037
50624
35,63%
Uganda
19534
55471
35,21%
Romania
26477
76604
34,56%
Brazil
121062
351765
34,42%
Thailand
17879
53934
33,15%
Ecuador
13919
43575
31,94%
Chile
11902
38158
31,19%
Argentina
20264
66341
30,55%
Belarus
20925
70071
29,86%
Colombia
23876
86638
27,56%
Ukraine
33664
141756
23,75%
South Africa
24262
104901
23,13%
Sweden
33762
217931
15,49%
Russia
71243
465210
15,31%
Hungary
11284
91060
12,39%
Australia
16134
183779
8,78%
Iran
10899
127491
8,55%
Canada
14223
227851
6,24%
United States of America
69600
1704614
4,08%
United Kingdom
19687
558880
3,52%
Italy
15283
477605
3,20%
Germany
19613
1941128
1,01%
(Countries with less than 10k Maxar changesets aren’t shown. The centroid of a changeset isn’t always in the country where the changes were made. Changes made in more than one country are only counted once.)
As a mapper from South Korea I also feel the unavailability of Maxar imagery immensely. Bing imagery is hopelessly outdated (at least 4 years old), and while Esri works in the meantime (at least 1 year old), it still doesn’t show new developments and is slightly lower resolution than Maxar. In a country where the government still strictly controls export of geographic data, and most of the existing POIs referring to Yahoo (stopped service in 2012), up to date imagery is the most valuable thing we have.
It would be interesting to compare Profiles of Changesets vs Objects edited
to assure tjat the Changesets statistic dont give more weight to projects / countries with contributors having very small edits per changeset. The number of objects edited are available from the changesets.
“ChangesetMD” (which I suspect we’re all using) does have the “number of changes” that you can see from the XML for a changeset on the website. However, you’d need to think carefully about how to use that to get anything meaningful. If you can suggest some SQL or a calculation someone can probably do it.
In changsetMD, num_changes refers to objects editted ( nodes + ways + relations) but do reference how many tags edited. Even if this is not a perfect measure of the intensity of mapping, it is significantly better then the simple changeset count. If we want both statistics, we simply use :
select created_a, count(*) as changesets, sum(num_changes) as obj_edited, geom from osm_changeset ...
One option might be checking if local government has Orthophoto imagery and if licensing allows using in OSM, if not email them and work towards government opening data… All this is long and tiresome process… And even after that you need someone to host tiles.
In Slovenia all this data is open and refreshes 1/3 of country every year and local GIS company https://level2.si/ is willing host tiles for OSM.
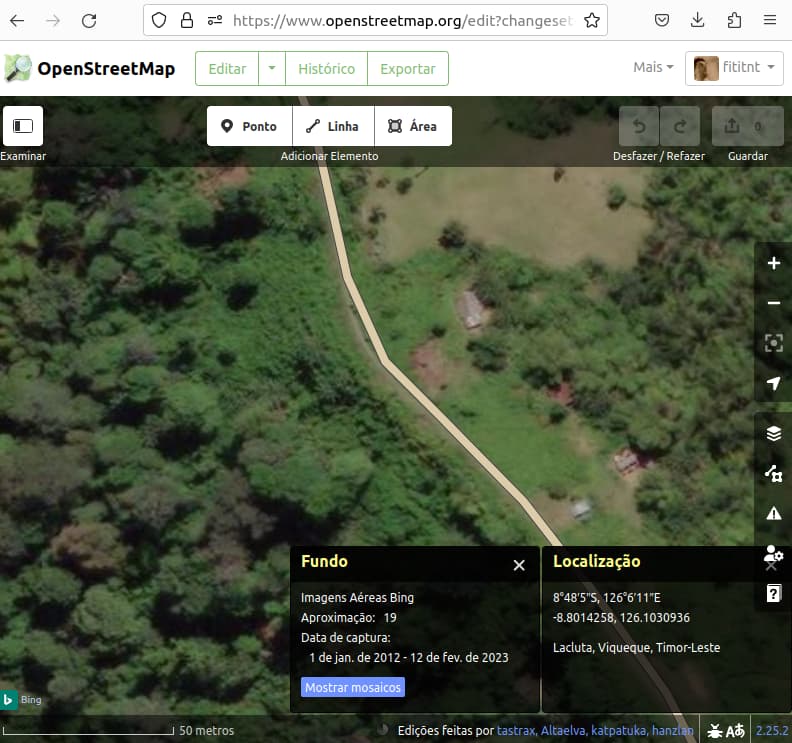
Data de captura:1 de jan. de 2012 - 12 de fev. de 2023
The photo is not even from the city area (which sometimes imagery tends to be more recent), but rural/remote area in Timor-Leste and is from 2023-02-12.
So, not sure about “how much outdated” Bing is expected to be, but even then, there’s ESRI, which often I found to be fairly recent (Maxar the iD does not reveal the imagery date, but I would not assume that just because Maxar, Mabox, etc don’t advertise date they are necessarily the most recent ones. Also, maybe coincidence, but in the places I do map, often Maxar had almost same imagery (but just don’t mention date) as ESRI or Bing).
A general statement about quality and actuality of different imagery providers simply is not possible.
All global imagery is a patchwork of countless small images stitched together from various raw images in order to avoid cloud cover, reduce license fees etc. etc.
Very often imagery from different providers is derived from the same raw source. On the other hand image capture may vary more than ten years.
This may vary drastically not only between countries but sometimes within kilometers. In some cases it may even vary within zoom levels.
In addition the “ranking” of imagery changes constantly as new imagery patches are made available by providers.
Maxar is no exception from it. There were regions in middle asia where the imagery was roughly ten years ahead of all others estmated from the amount of new roads built in the meantime. New built houses and replacement of wood by farmland are an additional hint for actuality.
Actuality of the road net on maps is a very important feature in difficult accessible regions. I just want to mention the Nepal earthquake.
In this sense the unavailability of Maxar imagery is a considerable loss in several regions whereas is does not matter at all in others.
Actually, Maxar -is- an exception. Essentially they are only constrained by their own economic considerations, this is very different than any other provider of an imagery mosaic that we have access to.
March 15, 2017, Facebook’s AI Assisted Tracing was announced on the OpenStreetMap mailing list. It used Digital Globe’s satellite imagery of Thailand to trace roads with AI and manually verify them using human input.
Several members of the OSM community demanded that Facebook should release the Digital Globe satellite imagery to facilitate the re-verification of all submitted contributions.
Digital Globe agreed to release the imagery only to registered OSM editors, through funding from “a group of organizations”.
May 9, 2017, DG-Premium and DG-Standard layers were released on OSM. Their EULA specifically stated that the imagery could not be downloaded for any other purpose than OSM contribution.
June 28, 2019, DigitalGlobe was renamed to Maxar, and the DG-Standard layer was renamed to Maxar Standard, while the DG-Premium layer was renamed to Maxar Premium.
December 19, 2019, Maxar announced that it had seen a sharp increase in usage through automated requests coming from a few areas of concern. As a result, it would soon suspend its imagery service.
2023 : It has been stated that the reason for the current outage is that a small number of people are using the OpenStreetMap API key to steal imagery for non-OpenStreetMap usage.
To present a complete yearly profile, I wrote my own analysis grouping this same Changesets data. I have a slighlty different perspective with 2022 changesets (the data I have on hand) by continent / Sub-continent (a least 70% of the changeset BBOX must be inside the Continent geometry). I also show other major imagery providers. I did analyse also with the variable num_changes (no. of objects edited). See PierZen's Diary | OpenStreetMap Imagery sources by Continent / Sub-Continent, 2022 | OpenStreetMap