The South African power grid in OpenStreetMap is starting to look quite good: Open Infrastructure Map
There are many new wind & solar schemes in the works: List of Developments | SAHRA
The South African power grid in OpenStreetMap is starting to look quite good: Open Infrastructure Map
There are many new wind & solar schemes in the works: List of Developments | SAHRA
Hi Ffy,
Yes, I occasionally track South African power lines and have worked on a few of the new solar sites in the north west, but I’m not allocating much time. But if there is a campaign I can allocatetime and interest.
Mostly I’m pushing at capturing power lines in Kenya where there are some interesting HV lines and geothermal plants going in. I love geothermal as a power source. I’m waiting for new photography to capture a few gaps in the Kenya-Ethiopia HV line.
Also worked on the Congo-Zambia HV DC line and the Cahora-Bassa HV DC line from Songo MZ and the Joburg terminus.
Yes, I’m an infrastructure geek!
Hi.
Why does Open Infrastructure Map not render generator:type=solar_thermal_collector?
It does generator:type=solar_photovoltaic_panel.
I suspect not. The site seems to focus on electric generators. Might be worth contacting the people who run the site: About - Open Infrastructure Map
Where would be the correct place to discuss issues regarding the power grid data?
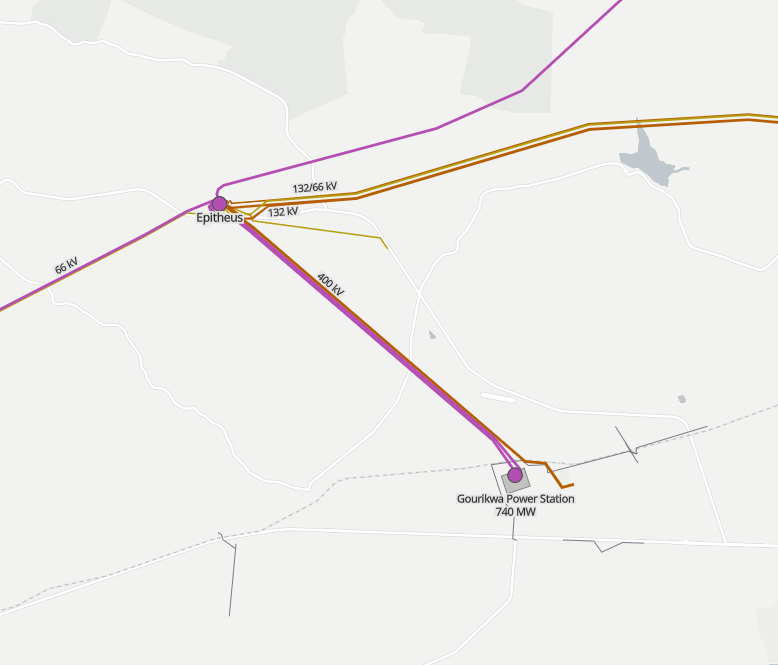
I believe there is a mistake in the naming of one of the large substations. As far as I know the susbtation at Mosselbay is called Proteus, not Epiteus like it’s currently named in OSM.
Yes, here is a great place to discuss it.
Indeed, I’ve noticed the potential Proteus mistake before.
Maybe we can find something on https://sahris.sahra.org.za/ to clarify?
A simple search on SAHRIS comes up with one result matching Proteus:
https://sahris.sahra.org.za/heritage-reports/aiaeskomproteustovleesbaaiaverygjan06
Nothing when I search for Epiteus.
Directly from ESKOM I found this PDF which talks specifically about the 400kV line between this substation and the OCGT Gourikwa (aka Gourikwa Proteus 400kV transmission power line):
Please review:
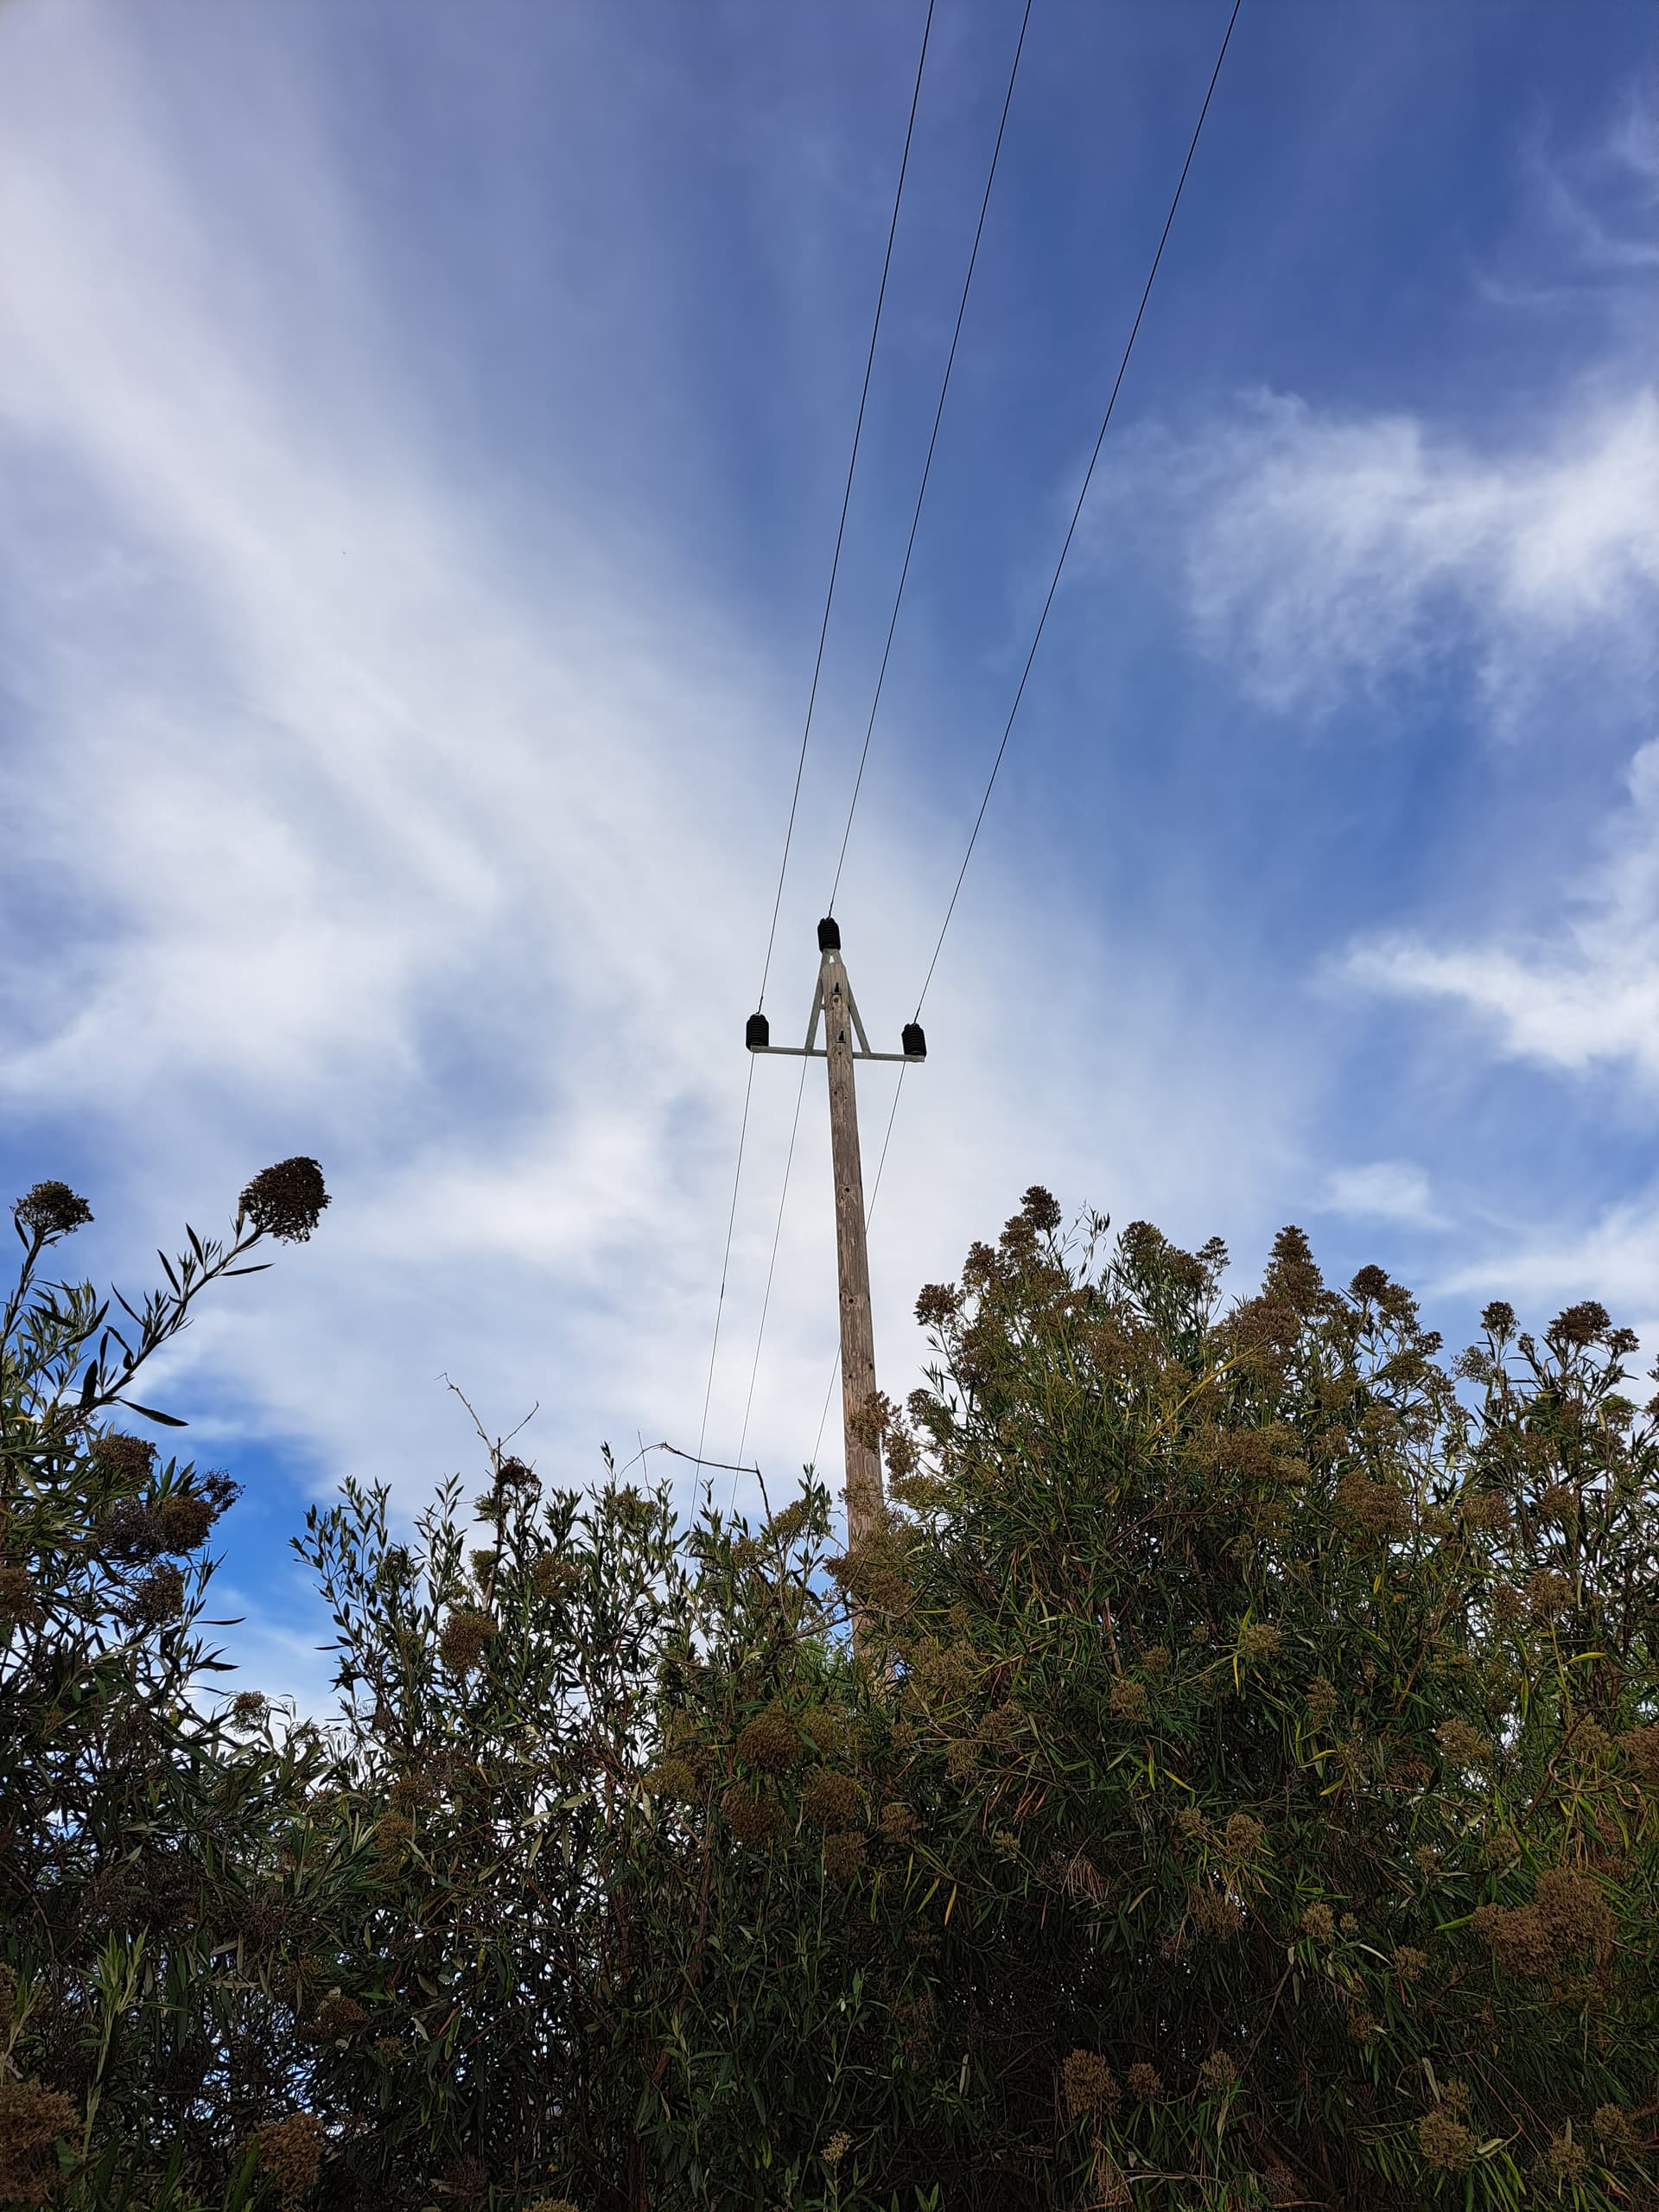
In SA there are many of these power lines with wooden poles, and three conductors arranged in a triangle.
Nodes:
Lines:
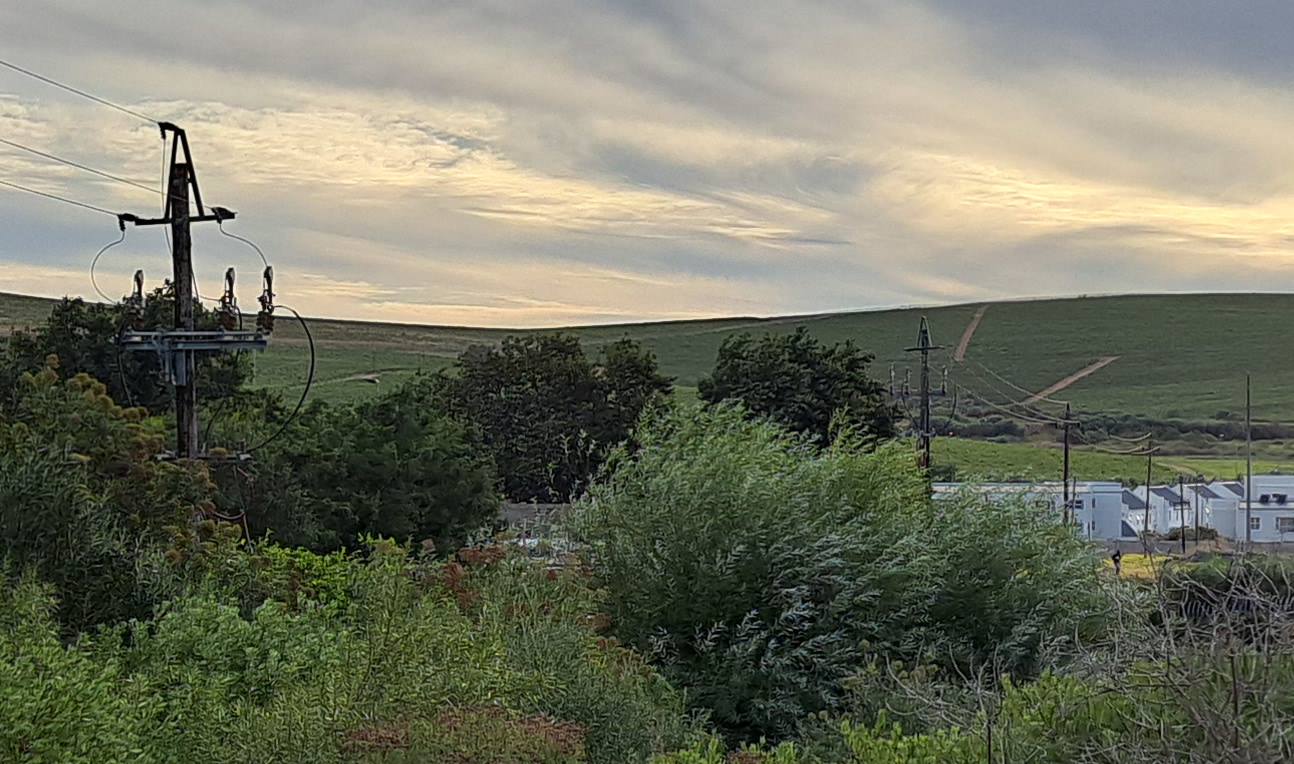
In the following photo we see one of these lines ending, going down into the ground, and then at the next pole, back up from the ground and the overhead line continuing. How would one map this? I used a “power=cable” for this section. My missing tags are however on the poles, as I do not know how to mark the overhead-to-underground and underground-to-overhead transitions correctly.
If the voltage is <20,000 I would tag the line as power=minor_line per Tag:power=minor_line - OpenStreetMap Wiki
I’m in and just adding this post to make this thread pop up in the future. Rural KZN in an area where Eskom always takes days to find line faults. In the current case (no pun intended) three days and counting. I don’t think they have their own map of where stuff is so time to start creating it.
@GaryMortimer thanks for adding this make it easy to keep track as well.
Thanks, we have power back so I have started! KZN Rosetta area