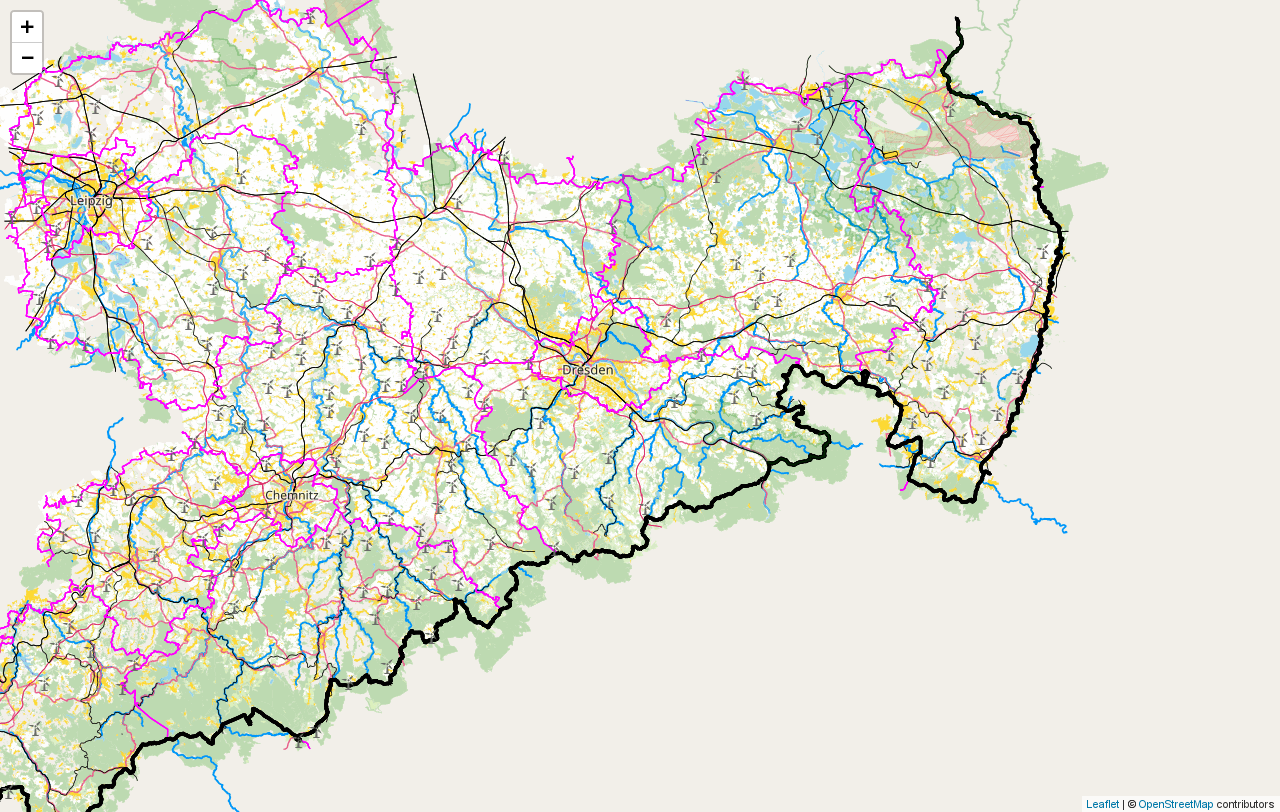
I already got to make some changes to the street/highway/railways/water, but what I didn’t got is to have just a boundary of the towns, filled up with a color.
I got something coloring the buildings, but so I have many colored building in the pampas that don’t need to be displayed…
Can someone suggest me how to do that?
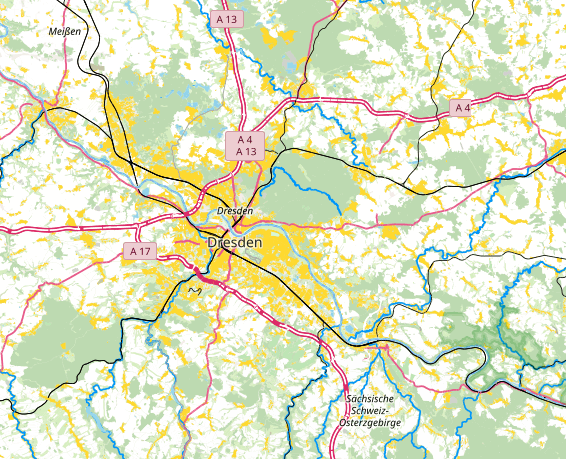
Currently I have this:
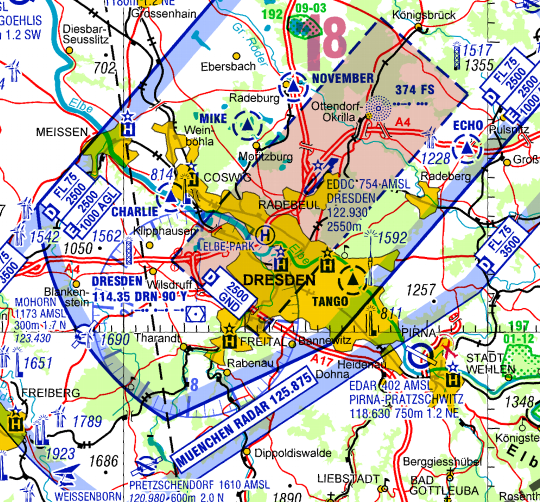
and I’d like to have this: .
I checked in the database and I see, there are no (reliable) city boundaries…
So I cannot display the boundaries in my map using this way.
Maybe it should be enogh, if I color the building shapes, as I already do, but I’d like to exlude little settlements, so my problem is to create a SQL-Query to filter the buildings that fill an area greater than X.
And now the problem begins again, since I don’t have an idea, how to filter the buildings by “aggregation size”…
Yes, it could be what I’m looking for, but…
I just want to draw the boundaries of “big/middle” town (let’s say: >= 25 km²).
What I actualy get, by searching all “administrative” with “admin_level = 6” is this:
OK, I got it with an SQL query that filter the towns and cities by size and population, as in the ICAO maps.
Now the next problem…
I display the boundaries as filled polygon, as in the ICAO maps, but right now the “z-index” is very high, so that other elements (highways, rivers, etc.) are hidden…
I didn’t found an attribute in Carto CSS to specify the z-index… Is it not possible? How can I solve this problem?
 .
.