The level of safety provided by bicycle routes on OSM varies quite dramatically. For example, part of the Olympic Discovery Trail is on a 50 mph highway with heavy traffic and no shoulder or sidewalk. This is in stark contrast to the Sammamish River Trail, which is completely separated from motor vehicle traffic and feels very safe to ride on. Both are tagged as a regional bicycle route. This can be pretty misleading if you’re looking at a map and trying to decide the best way to get somewhere.
Are there any proposals for an indicator of safety for bike routes (or segments of bike routes), perhaps similar to the SAC scale for hiking trails or the difficulty of ski runs? I’m aware that such a proposal would come with some controversy, just as the SAC scale did.
There is class:bicycle as a kind of subjective ranking of routes for suitability for cycling. However, this takes into account not only safety but also comfort, the view and the volume of traffic (even on cycle-only paths).
There are also some subclasses that are explicitly only for MTB (class:bicycle:mtb) or road bikes (class:bicycle:roadcycling). The key is even taken into account by some routers such as BRouter or GraphHopper.
It’s worth to have a look in the talk section as there are a lot of controversy discussion about verifiability.
A smart router can combine OSM data (such as highway type) with external data (such as traffic volumes) to steer people onto safer roads.
Any attempt to rate roads on a safety scale won’t work, because cyclists’ perception of safety and their interaction with traffic varies widely. For example, I feel safe cycling on country lanes even with sharp bends and high hedges, whereas American cyclists coming over here often find these unnerving. Conversely, I really don’t feel safe cycling on a hard shoulder of a busy road, which is standard practice among many American touring cyclists.
Both are tagged as a regional bicycle route. This can be pretty misleading if you’re looking at a map and trying to decide the best way to get somewhere.
Something being tagged as a regional bicycle route just means it’s a regional bicycle route. It doesn’t warrant that it’s safe and isn’t intended to.
My suggestion would be to put exactly these objective information in to tags. Additionally number of lanes,… That’s by far more beneficial than any -3…3-rating
I would also recommend mapping the physical attributes as accurately as possible rather than using a subjective “quality score”.
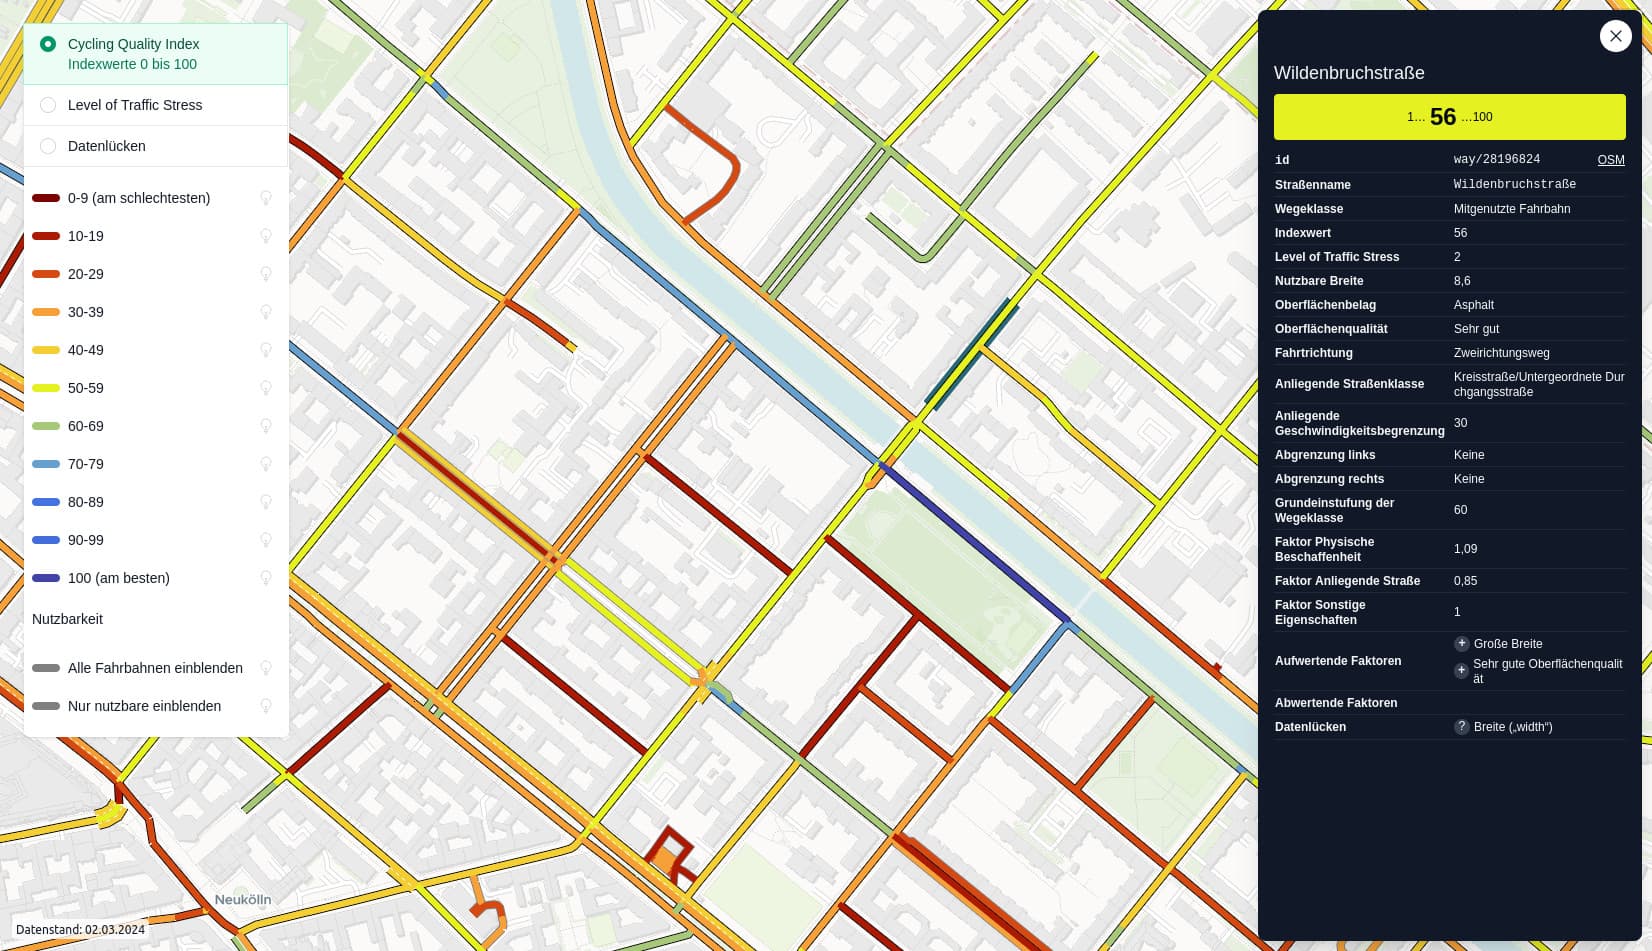
I’m currently working on an OSM-based cycling quality/safety index and I’m surprised how well it works when the physical attributes of roads and paths are mapped as completely as possible. I’m analysing surface and width information, highway categories, maxspeed, but also more specific tags such as separation or buffer. There is only one factor that we cannot map well in OSM, and that is the amount of traffic (even if there are experimental tags for this). But even this could possibly be included from external data for analyses.
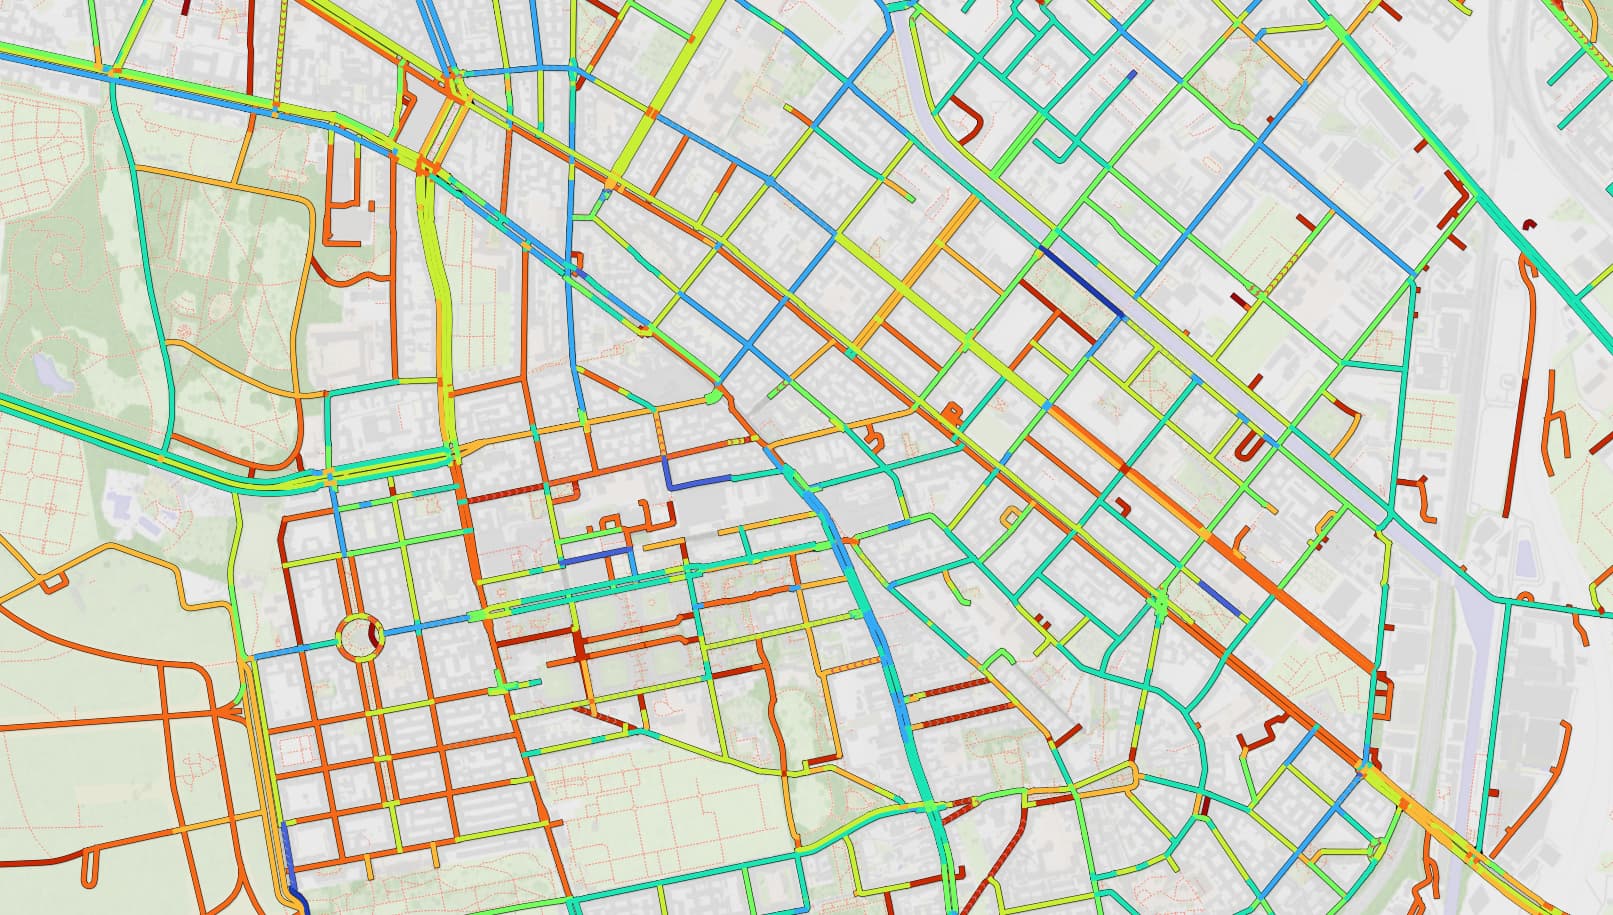
(Example: blue paths are good for cycling, red ones are not)
This looks great! Have you published your project online somewhere?
I’ve been adding cycleway:buffer, maxspeed, and cycleway:doorzone to many of the roads in my area. Subjectively, I’ve found the width (cycleway:width) to be pretty important, but that requires more work to survey so I haven’t been adding it.
Many cities in the US publish traffic reports that contain the motor vehicle volume on arterial roads (typically highway=secondary or greater in OSM). They usually report the average daily traffic volume, which could be represented with traffic:hourly.
Slightly off-topic: do you have code or instructions that one could replicate to make the same kind of visualization for a given city? I’d be very interested in that
edit: sorry, I got too excited after reading your post and only later noticed that @pesticides had essentially asked the same thing already!
@pesticides@waldyrious The project is still in progress, I will publish the code soon (a PyGIS script, i.e. a Python script for QGIS). In two months I will also give a talk on this at the German FOSSGIS conference to discuss the method.
Along this same line, please shame your local governments into building safe infrastructure instead of posting signs on a high speed motorroad declaring it a cycleway and allowing cars to continue using it with no safety considerations made…
@pesticides@waldyrious FYI yesterday, there was a talk about our “Cycling Quality Index” on the German FOSSGIS conference and we have a webmap to demonstrate the index for the city of Berlin now:
In the future, we would like to scale this, i.e. extend it to larger areas/other cities. To do this, however, we need to improve the technical setup - the current “hobby python” script is not sufficient for that. Currently, it’s just a prove of concept.