Below is a description of how I combine mapproxy, Level0, and some minor Python scripts to improve my efficiency in editing OSM.
I am aware that “efficiency in editing OSM” is subjective. What matters for me now is the ability to express my decisions in as few keystrokes as possible, while remaining fully aware of what’s going on with every single feature I edit.
Nothing groundbreaking or important. It’s quite a long post, completely fine to ignore. If you do happen to read it: thanks! Feedback is welcome. Also, if for some reason I should stop editing like this, I’d like to know.
Step 1: Identify potential features to edit
If there is no existing crossing tag, all highway=crossing nodes where zebra markings are visible can be tagged as crossing=uncontrolled in Norway. (See this for exact reasons - they don’t matter for this post).
I download a set of crossings I care about using Overpass API. Let’s say I work in Akershus, id: 406106 (it’s a region mostly around Oslo, see Norway subdivisions). Here is query.ql:
[out:json][timeout:25];
relation(406106);
map_to_area->.searchArea;
node["highway"="crossing"]["crossing:markings"!~"."](area.searchArea);
out body;
>;
out skel qt;
Strictly speaking, I could’ve gone without ["crossing:markings"!~"."], but since it doesn’t really matter which crossings I choose as long as I have many, I went with this query. Get the response to a JSON file:
curl --request POST --data @query.ql "https://overpass-api.de/api/interpreter" --output res.json
With Python, I filter the response further, so that I only have those which don’t have a crossing tag already:
import json
import shapely.geometry
import geopandas as gpd

with open('res.json') as f:
    d = json.load(f)

res = d['elements']
noCrossingTag = [e for e in res if 'crossing' not in e['tags'].keys()]

gs = gpd.GeoSeries([shapely.geometry.Point(e['lon'],e['lat']) for e in noCrossingTag]).set_crs(4326).to_crs(3857)
featureids = [e['id'] for e in noCrossingTag]
gs is a GeoSeries of Points, featureids is a list with the OSM IDs of those points.
Step 2: Produce imagery for each selected feature
The Norway Orthophoto source in iD has quite high resolution. In most cases, it’s perfectly possible to see whether or not a crossing has zebra markings. It’s a TMS. After creating a simple mapproxy.yaml:
# Launch via: mapproxy-util serve-develop mapproxy.yaml
# Add this GetCapabilities link to QGIS: http://127.0.0.1:8080/service
services:
  wms:
    md:
      title: "WebAtlas Ortho WMS"
      abstract: "WMS service for WebAtlas orthophoto tiles"
    srs: ["EPSG:3857"]
    image_formats: ["image/jpeg"]
  demo:

layers:
  - name: webatlas_orto
    title: WebAtlas Ortho Tiles
    sources: [webatlas_orto_cache]

caches:
  webatlas_orto_cache:
    grids: [global_webmercator]
    sources: [webatlas_orto_source]

sources:
  webatlas_orto_source:
    type: tile
    url: https://waapi.webatlas.no/maptiles/tiles/webatlas-orto-newup/wa_grid/%(z)d/%(x)d/%(y)d.jpeg?api_key=b8e36d51-119a-423b-b156-d744d54123d5
    grid: global_webmercator

grids:
  global_webmercator:
    base: GLOBAL_WEBMERCATOR

globals:
  cache:
    base_dir: "./cache_data"
    lock_dir: "./cache_data/locks"
It’s possible to launch a local WMS service relying on those tiles via mapproxy-util serve-develop mapproxy.yaml. After the WMS is up, I can generate imagery for each feature:
import time
import requests
from tqdm import tqdm
from io import BytesIO
from PIL import Image, ImageDraw

!rm -rf images
!mkdir images
def save_image(x, y, featureid):

    s = 100
    bbox = ','.join([str(e) for e in [x-s/2, y-s/2, x+s/2, y+s/2]])
    url = f"http://127.0.0.1:8080/service?SERVICE=WMS&VERSION=1.3.0&REQUEST=GetMap&BBOX={bbox}&CRS=EPSG%3A3857&WIDTH=1000&HEIGHT=1000&LAYERS=webatlas_orto&STYLES=&FORMAT=image%2Fjpeg&DPI=144&MAP_RESOLUTION=144&FORMAT_OPTIONS=dpi%3A144"

    response = requests.get(url)
    if response.status_code == 200:
        img = Image.open(BytesIO(response.content))
    else:
        raise Exception(f"Failed to fetch image, status code {response.status_code}")

    draw = ImageDraw.Draw(img)
    width, height = img.size
    center_x, center_y = width // 2, height // 2
    l = 50

    draw.line([(center_x + l, center_y), (center_x + 3*l, center_y)], fill="red", width=3)
    draw.line([(center_x - l, center_y), (center_x - 3*l, center_y)], fill="red", width=3)

    draw.line([(center_x, center_y - l), (center_x, center_y - 3*l)], fill="red", width=3)
    draw.line([(center_x, center_y + l), (center_x, center_y + 3*l)], fill="red", width=3)

    # Draw a circle
    draw = ImageDraw.Draw(img)
    width, height = img.size
    center_x, center_y = width // 2, height // 2
    circle_radius = 50  # Radius of the circle

    # Define the bounding box for the circle
    top_left = (center_x - circle_radius, center_y - circle_radius)
    bottom_right = (center_x + circle_radius, center_y + circle_radius)

    # Draw the circle
    draw.ellipse([top_left, bottom_right], outline="red", width=3)


    # Save the new image
    output_path = f"images/{featureid}.jpeg"
    img.save(output_path)
    time.sleep(0.2) # be nice

for ([x], [y]), featureid in tqdm(zip(gs.geometry.apply(lambda row: row.coords.xy), featureids),total=len(gs)):
    save_image(x, y, featureid)
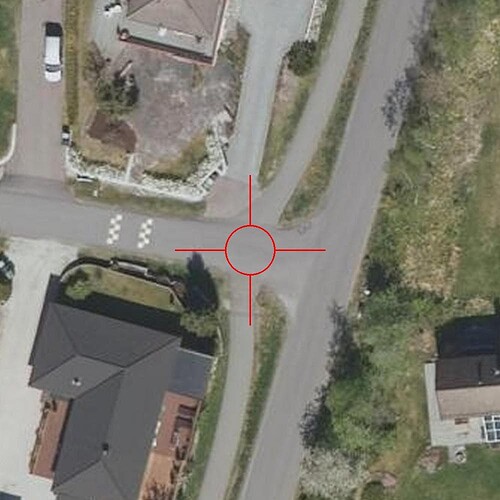
This step has produced images like this:
Filenames show which feature the image is centered on. For Akershus, this process resulted in 773 images. (More examples.)
Step 3: Select images with zebra markings at centres
This is the fun part. Now that there are several hundred images in a directory, I need to select the ones which show a zebra in the middle. There are several ways to do this so that 1 decision, 1 keystroke (or click, depending on preference). For example, use the solution mentioned here, or just upload the iamges to a public bucket and use this site (my chosen method). A somewhat pixelated short clip about this step.
After selecting images which definitely have a zebra in the middle (I selected these - probably there are others which could’ve been selected as well, but what matters the most here is that there are no incorrectly selected ones), I create a nodelist. (A few lines of Python code, but it depends on what method was used for image sorting so I won’t include specific code here.)
Step 4: Add tags to selected features
Coppy the nodelist to Level0:
click Add to editor. When text is loaded:
copy that to a separate file, ie editorcontent.txt. For each node, I’ll add crossing = uncontrolled. This is probably very easy in many programming languages; I do it like this in Python:
input_file = "editorcontent.txt"
output_file = "out.txt"

with open(input_file, "r") as infile, open(output_file, "w") as outfile:
    inside_node = False
    for line in infile:
        stripped_line = line.strip()
        if stripped_line.startswith("node"):
            inside_node = True
            outfile.write(line)
        elif inside_node and stripped_line == "":
            outfile.write("  crossing = uncontrolled\n\n")
            inside_node = False
        else:
            outfile.write(line)
    if inside_node: # Handle case where the file ends without a blank line after the last node
        outfile.write("  crossing = uncontrolled\n")
This produces out.txt. A few example lines:
node 1422974558: 59.9038598, 10.5756223
  highway = crossing
  crossing = uncontrolled

node 1449607423: 59.9108935, 10.6393562
  highway = crossing
  source = bing
  crossing = uncontrolled

node 1455011817: 59.8736342, 10.4951950
  highway = crossing
  crossing = uncontrolled
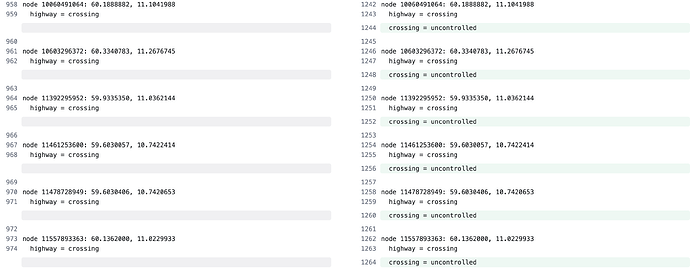
Delete what’s in the text field of Level0, and insert the context of out.txt. Great care is needed here, if this step is messed up somehow, hundreds of features will be damaged. I recommend checking the changes made via diffchecker.com or similar, to make sure the changes done are indeed the desired changes, and only those. A diffchecker screenshot:
After double checking and giving a meaningful Changeset comment, press Check for conflicts button - if everything ok,and then press Upload to OSM! Done! The changeset.
Step 5: Double check
Then, I head to OSMCha and find the changeset. It should only contain tag changes, and it should not contain any geometry changes. Reassuringly, it does not:
Thoughts
What I like about this workflow is that only step 3 scales with the number of features I edit, while all other steps take constant time. (Constant in the practical meaning of the term.) Step 3 requires only 1 button per image, and then the next image is shown, straight. (There is Previous button in case I need to change my response.)
I hope this workflow is applicable to more areas than tagging whether a zebra crossing is uncontrolled or not. To mention a highly related one: I could’ve focused on crossing:markings=zebra, and the same workflow would’ve worked. A more involved version of this would be to look at street level imagery as well, not just orthophotos. Ie I could count the “number of different phase conductors” for a powerline, check line_attachment, or other aspects of power_towers. (I’m quite into powerlines.)
If there is something I didn’t think of, and I should be more careful/stop with this, tell me. I really enjoyed working with Level0.


