In my capacity as HOT’s Community Strategist and Research Lead, I would like to share with you a closer look at the evolving landscape of OpenStreetMap (OSM) contributors, especially in the context of local knowledge and its crucial role in our mapping efforts in some countries.
Our study reveals a trend in local knowledge contributions in OpenStreetMap: a small but dedicated number of local mappers, making up just about 3% of contributors who are in the area mapping, is responsible for approximately 75% of the detailed mapping contributions.
This study enables further opportunities for data-analysis & research in your local countries and I hope it’s useful to understand better the dynamics and opportunities ahead to keep growing and supporting a sustainable OSM.
I hope you like it!
Note: All code to re-create the study in new locations has been published and can be run locally or using a Google Collab notebook by non-technical people in less than 15 minutes.
@pedrito1414 presented this work on my behalf during de SoTM EU 2023
Excellent article, thanks Ruben and Pete! As an author of an editor to collect local knowledge (at levels 3-4), I also wonder if that 1% of core contributors is an indicator of how hard it is to find tools for contributing local knowledge.
Like, you don’t have JOSM on you when you’re in the city, and StreetComplete is mostly about roads. After releasing an editor inside Maps.Me, we have seen a drastic increase of prolific mappers in locations with no OSMers in the common sense of the term. So maybe it’s not that some mappers devote more time, but very few can find and learn the right tools.
Okay I’ve just read the notebook, and the numbers are for users who last edited nodes with place/amenity/shop/opening_hours/etc tags. So I’m pretty sure we’ll get many bots in there. I think my call for proper POI statistics from my SotM EU talk still stands
You are leaning very very very far out of that window. There have been only 15 contributors ever that started out with maps.me and that have more than a meagre 100 mapping days (with any editor and accumulated over the last 7 years) .
Haha thanks Simon I know. The idea was to get a long tail, and that’s what we got. But also that editor enabled people who already edited OSM (with varying levels of participation) to add POI to their focus. And from those we got requests for improvements. I heard that people used maps.me even from home, because with POI it was easier than iD/JOSM.
I had a look at the data for my local region (Andalucía, Spain) and it supports this observation. Also imports, for example from government/official sources such as cadastral data - not automated or bots in this case, but also not local mapping . I know that a lot of addr:housenumber tags here are from official data: removing just that one tag from “other_keys” in the code immediately removed one third of the original data. Looking at the remaining data I see very frequent occurrences of tags that do not necessarily require local mapping (contact details, wikipedia/wikidata/brand:wikidata etc.) And at least 4 of the top 12 contributors have user names indicating they are bots or import accounts. I think I would need to do a lot more work on this to get it to a point where I could confidently say it gives a true picture of purely local mapping.
I have no doubt that it is true that a small number of contributors account for a large proportion of contributors, but I am not sure if this data tells us a lot more than that, at least for regions where mapping is already quite developed.
It was you that claimed a sudden influx of “prolific” mappers due to maps.me.
And yes clearly we need some support for people that infrequently add a POI or so, but, to get back on topic: years of experience and the numbers clearly demonstrate that maps.me et al are dismal, if not catastrophic, at onboarding mappers that will grow to regular contributors, with other words those 3% that contribute 75% of the data.
To be sustainable we need to at least maintain, if not grow, that 3% and not any other segment.
I love it. Great to see HOT folks putting attention towards local mapping. I mean I think HOT has always recognised the value of local mapping, but there’s always that difficult stark contrast between folks drawing in large quantities of buildings data remotely, versus any local mapping we might manage to encourage.
Not surprising that there’s the steep long tail drop off within local mapping changes, as seen in any segment of the data. The ratio of local<->remote mapping in different countries seems easy to predict too (but maybe there’d be some surprises?) I think it would be fun/interesting to see snazzy visualisations like “year of edits” based only on local mapping edits.
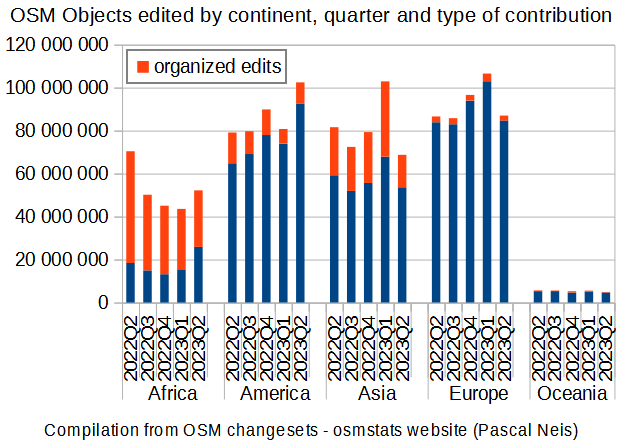
Buildings count for a large part of the Planet OSM and often added tracing remotely from backround image or simply imported… It is easy to add remotely thousand of builldings with only building=* tag in one day. Other fancy mapping is a lot of effort but count less in statistics. Badly the Changesets Planet file provides only the total objects edited (ie. node + way + relation). When excluding building=* edits (and imports, and reverts …) from the analysis, would already provide a quite different perspective over OSM contributions and contributors. I am not saying that such contributions are useless, but their magnitude hides other types of contribution.
Several years ago I was interviewed for Mapper of the Month and was asked “What tools do you use?”
After mentioning JOSM (and its Validator plugin), Geofabrik’s Inspector, WeeklyOSM, OverpassTurbo, MapRoulette and our Notes feature (among others), part of my answer was "one of OSM’s best tools in action is local personal knowledge.”
That remains exceedingly true, and I believe will remain true as long as OSM exists / grows into the future. Local personal knowledge is the foundation of our map data. Yes, it is certainly possible and quite viable (as with HOT contributions) to map data that are “less known” on a personal, first-hand basis. But when it is your neighborhood, train route, bike path, library, football pitch, off-road-motorcycle-trail, university, camping site…it makes each and every Contributor who adds those data to our map stand a little taller, I think. And obviously, this makes for a “stronger” map.
Let’s do everything we can to continue to encourage this excellent trend.
That’s one of the reasons I’ve looked at numbers that are not just volume (edits), but long term engagement (mapping days), based. As said maps.me (and similar tools) doesn’t just fail on the former it fails on the later too.
I published a compilation of contibutions in PierZen's Diary | OpenStreetMap that offers a perspective on Organized editing, particularly with it’s great share of objects edited in Africa. See the graph below.
Where should we allocate resources in supporting local knowledge contributors - new people to OSM, mappers who have shown inclination to add local knowledge or the core mapper group?
Each local knowledge contributor has their own (subjective) perspective regarding the places they have been living or visiting in the past. Sometimes, this perspective conflicts with fellow local knowledge contributors (or worse, remote mappers who don’t know anything about that place other than (probably outdated) satellite imagery), leading to the removal of a certain perspective from the OpenStreetMap database. In the average case, it is simply deleted and overwritten. In the worst case, edit wars may occur, leading to one (or more) contributors giving up on this project for the long term.
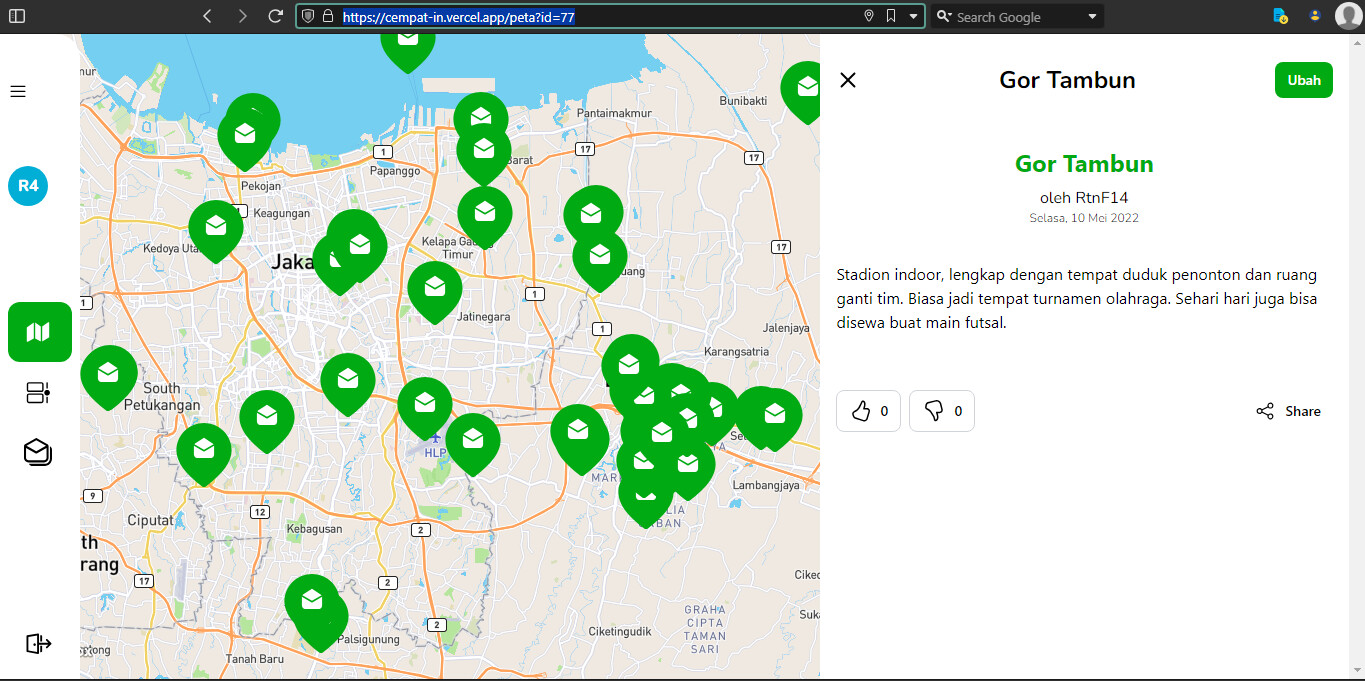
One of my ideas is to create (yet another) platform that allows each of these unique perspectives to be preserved—a platform that enables each local knowledge contributor to simply dump everything they know about certain places they’ve lived and visited before, free from anyone else’s interference and the limitations of the current OSM tagging scheme.
This (proposed) platform is not aimed at replacing OSM altogether, but it serves as a complementary system that allows for a more nuanced perspective regarding a place to be documented and preserved more effectively.
Here’s the prototype. The premise is very simple: you can write a free-form story about a certain coordinate. It may seem like yet another glorified OSM notes, but simple plaintext could also encode knowledge and information (to some degree).
Make an inclusive community of local knowledge contributor. Encourage them to share everything that they know about places they’ve lived and visited before.
I found your analysis very interesting, thank you for all the stats and reflections. I’d like to share with you the analysis of North Korea by the researcher Wonyoung So (from 12th may 2021) on his website https://cartographers-nk.wonyoung.so/, which I’m sure will be of interest to you in both form and content!