Yes, it’s kind of like that, except I’m suggesting that we eliminate the monstrosity (multi)polygon objects and “agree” (come to consensus) that an OSM way be a “compromise solution” to “node not enough, (multi)polygon too much.”
@pyram, you and I have noticed that similar issues exist for mountain ranges, and again, I don’t want to get side-tracked about that here in this thread, but I believe similar oddities (“how do I best tag this so it renders nicely without ‘tagging for the renderer’?”) exist for many “linear features” of OSM.
Edit: Refining this a bit more, what if we coin a new relation type (I’m open to a good value for type=) consisting of simply a name= tag and members which are a line (to describe a render path) and perhaps a single node (centered, “identifying,” similar to role=label in boundary relations). Seems it needs some further sharpening of focus, but we can invent such things, and maybe in this case / these cases, we should.
Just read this tread, trying to see if I understand the basic information problem.
Is it correct to say that, in order to have enough information to properly render the name of an area (including huge and irregularly shaped areas), you need the polygon, but not necessarily all the details?
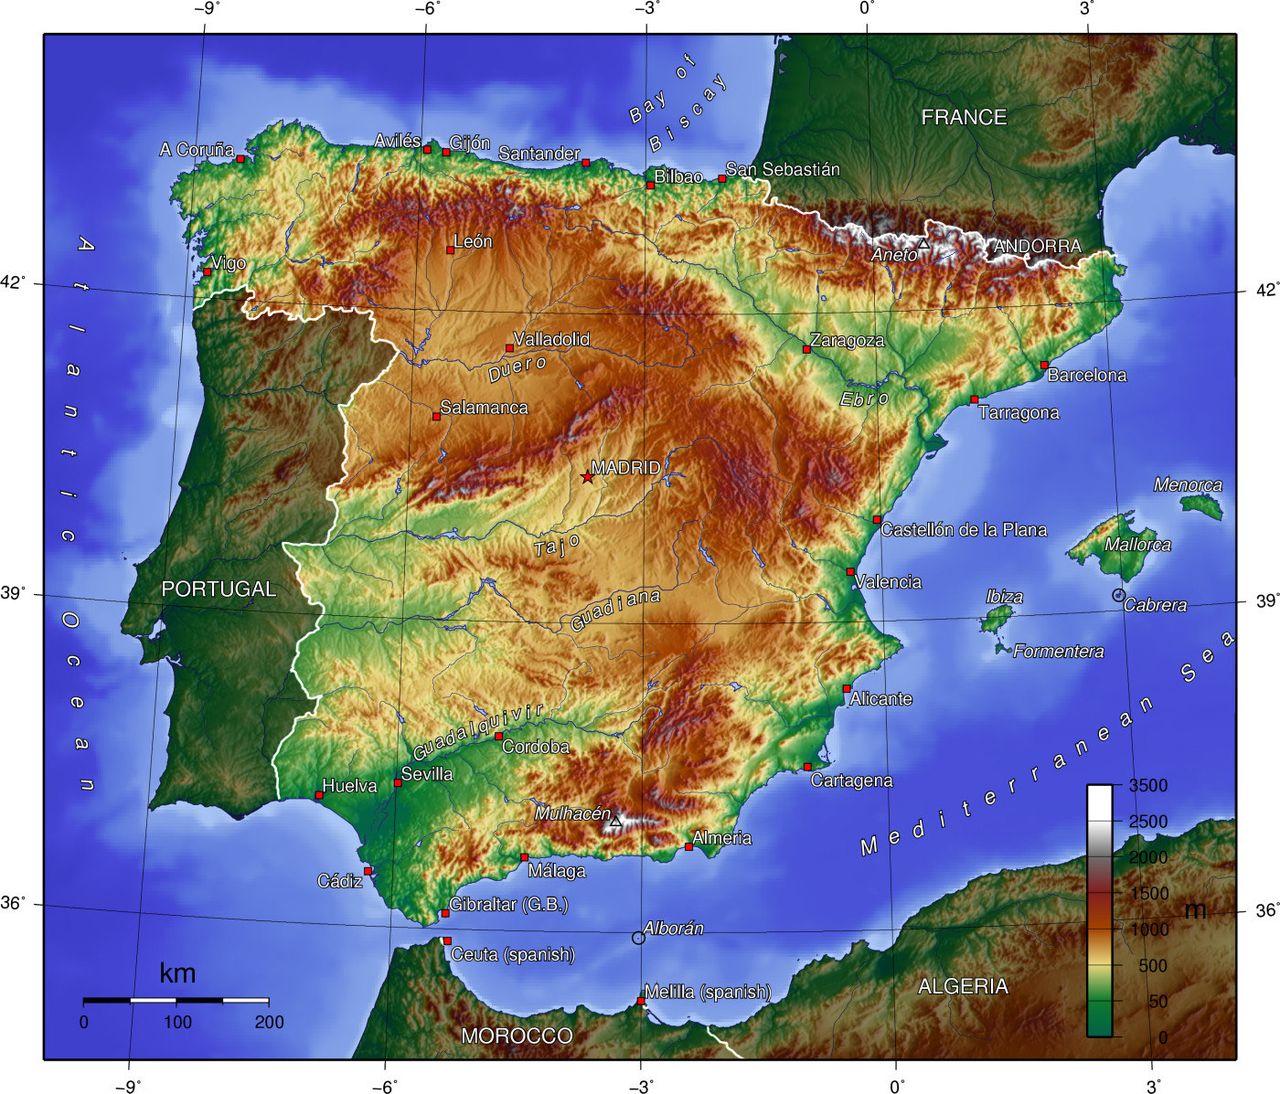
And that some details are important, e.g. Italy protruding into the Mediterranean sea, but you don’t need every indentation and protrusion of the entire coastline of Italy?
Peter, you are on the right track, as some of what you identify is true, yet so is more: there are numerous issues, some subtle and technically complex.
We are trying to render “large things,” (seas in particular) and their hugeness and irregularity are part of the problem. Part of it is that monster polygons are both unwieldy, far too large, and almost always inaccurate (similar to how coastlines attempt to model a fractal-based boundary which can’t accurately be done, except to some level of error which might or might not be acceptably not-too-wrong).
And part of it is that it seems to be emerging that it is “correct” (as @ZeLonewolf 's proposal makes clear) that a node can suffice to denote such things. (Again, a “sea” in particular). But we also recognize that a node is often insufficient to allow “decent” (pretty, accurate…) rendering. And so, we bump against our tenet “don’t tag for the renderer.”
This is very much “wet paint” right now; the discussion is ongoing. It seems it has been for at least a decade or longer, too.
Yes. (Both). If a (multi)polygon is >2000 nodes, some toolchains choke or struggle or die. Same for >2000 ways as segment members of a multipolygon, for example. And as “seas” are some of the geographically largest objects OSM represents, and various “solutions” (more like ad hoc implementations — no harsh judgement by me as I say that, I’m all for “refining our data” with a sloppy version 1 that becomes a better v2 and a wide-consensus, essentially what-we-do-now v3, for example) have been entered, not only do these become apparent on a global scale, we get different flavors of them. And large and unwieldy examples of them. And “hey, we’ve had this problem for at least 10 or 12 years, also on mountain ranges…”. And here’s a potential solution that can help simplify by reducing things to just one node. And “well, what about how we’re going to render those?”
All at the same time.
We can do this. We keep talking to each other, that’s how.
I’m actually using @woodpeck’s delightful term “beast” polygon, and it specifically refers to the number of ways, with the worst offender (Labrador Sea) containing over 11,000 member ways, which have a total of 292,136 nodes.
The geographic size of the thing, in my opinion, is not at issue.
We could say that very large, named areas are simply out of scope–as we do for no longer existing historic features. If we were to do that, how would you suggest delineating the size of area that is in vs out of scope? I guess very large countries and lakes would be included since their boundaries or areas are typically rendered? Would label nodes for small bays be in scope since they typically wouldn’t be rendered at small scale? How small exactly is small scale? Data consumers would want a clear distinction between what they should and should not expect to find in OSM so they know what to fill in from another data set. Besides excluding entire classes of features (large and small), I can’t think of clear way to do that.
So, at one extreme a single node can carry all the information needed to enable correct assignment and rendering of the label in many cases. The node, I think, should verifiably represent the center point of the area. How renderers fit the label on or in the area is their thing, and they have shown that they can do it.
At the other extreme a beast (multi-)polygon carries the information needed to enable correct assignment and rendering of the label.
In between are cases where a node is not enough but a line (i.e. a collection of nodes representing the estimated shape of the area) carries enough information to enable correct assignment and rendering of the label in many cases. The line does not need to be exact, but it does need to verifiably represent the area. It gives renderers more how-to-fit-it information than just a node, because of the length and course of the way
I understand this is as yet just an idea? From an informational point of view it does the job for many cases, I think. From a node to line, that is almost a mathematical generalization.
But in some cases it would seem even a line would not be enough to carry the information.
My first tentative question there would be: how about trying (as a thought experiment) the line idea first? Maybe it would solve more cases than you would think at first sight. Lines are flexible!
My second tentative question would be: what kind of (verifiable) OSM database object could carry enough information for the purpose?
And the third tentative question: what is the minimal size and complexity such an object could have to verifiably represent the area in question, and still carry enough information to enable correct assignment and rendering of the label?
I believe you have the situation sized up essentially correctly.
Yes, it is an idea to tag elongated seas with place=sea tagging on a line. However, this style of tagging is already used today for natural=strait along with all forms of river tagging waterway=river/canal/stream/ditch/drain, which are used for labeling in the exact same way. There are 1.7million river ways which all represent the “approximate middle” of a river, and I’m suggesting that the same should be allowable for a sea that has that kind of shape.
The waterways are at the same time used for connectivity and routing.
In fact for roads it’s the same. Mapping and tagging the center line eliminates the need to map the road area. Mappers now generally map the road area by not mapping it. The surrounding land use / land cover shows the area. Sort of not mapping for the renderer.
Agreed, they are multi-purpose, not just for labeling. I was really trying to highlight that we draw a waterway=river line more or less arbitrarily in more or less the middle of the river, and this arbitrariness doesn’t seem to cause problems.
As an aside, and encouragement (as I think we are on the right track in this thread), I had / have experience with rail tagging in OSM, where I was faced with the largest import of rail on Earth into OSM (the USA’s Census Bureau 2007-8 TIGER import included hundreds of thousands of km of railway=rail). I struggled for a couple of years trying to reconcile this with how people in Germany developing early versions of OpenRailwayMap and tagging in Germany as well as greater Europe and indeed the world over didn’t “blend and merge” very well with what was “ideal” tagging, what had been imported, and how others around the world were tagging rail.
A shortened version of what I/we did in a case like this was to notice that in Germany, there were three “levels” of rail (relations): route=tracks and route=railway for track infrastructure plus route=train for passenger routes. The route=tracks relations (especially as entered in and around Germany) seriously and repeatedly confused many in the USA and North America. So, as I explored what seemed to be their superfluous nature, I did some small-scale experimentation with conflating these “three into two” by eliminating route=tracks as potential/possible or even actual relations in the USA. This simplified version of “only two” relation types (route=railway relations for “infrastructure only,” effectively conflating tracks and railways, plus route=train for passenger routes, that didn’t change) meant that rail tagging and improving our TIGER import data became understandable, accessible and hence, was “off and running.” We’ve spent the last decade substantially cleaning this up, and we did it because we were “bold enough” to try a “new version of something” (it is actually a simplified version). We have found it didn’t really “break” anything downstream (routers, renderers, including OpenRailwayMap itself).
The moral of this story is that something similar appears to be happening here with “better data representations for very large objects like seas.” We have learned that a node is sufficient, it is likely a way is better, and that indeed, ways have been used for things like river courses and other (even navigable) waterways. It can be surprising, as I and others noticed back around 2012-14 with rail, and Brian notes above about rivers, that “this arbitrariness doesn’t seem to cause problems.” I’d like OSM to continue with that spirit of positive experimentation, as indeed, it seems we are gaining altitude in making “big improvements” (to paraphrase @woodpeck ) to “beast” (multi)polygons. Yay, us!
In practice, it often is an eyeballed centerline, but some mappers try to make it represent the thalweg. Either way, we can think of it as an abstraction. The “centerline” of a V-shaped valley is another example of an abstraction. In that case, thankfully no one expects mappers to delineate the valley floor based on precisely where it meets the foothills.
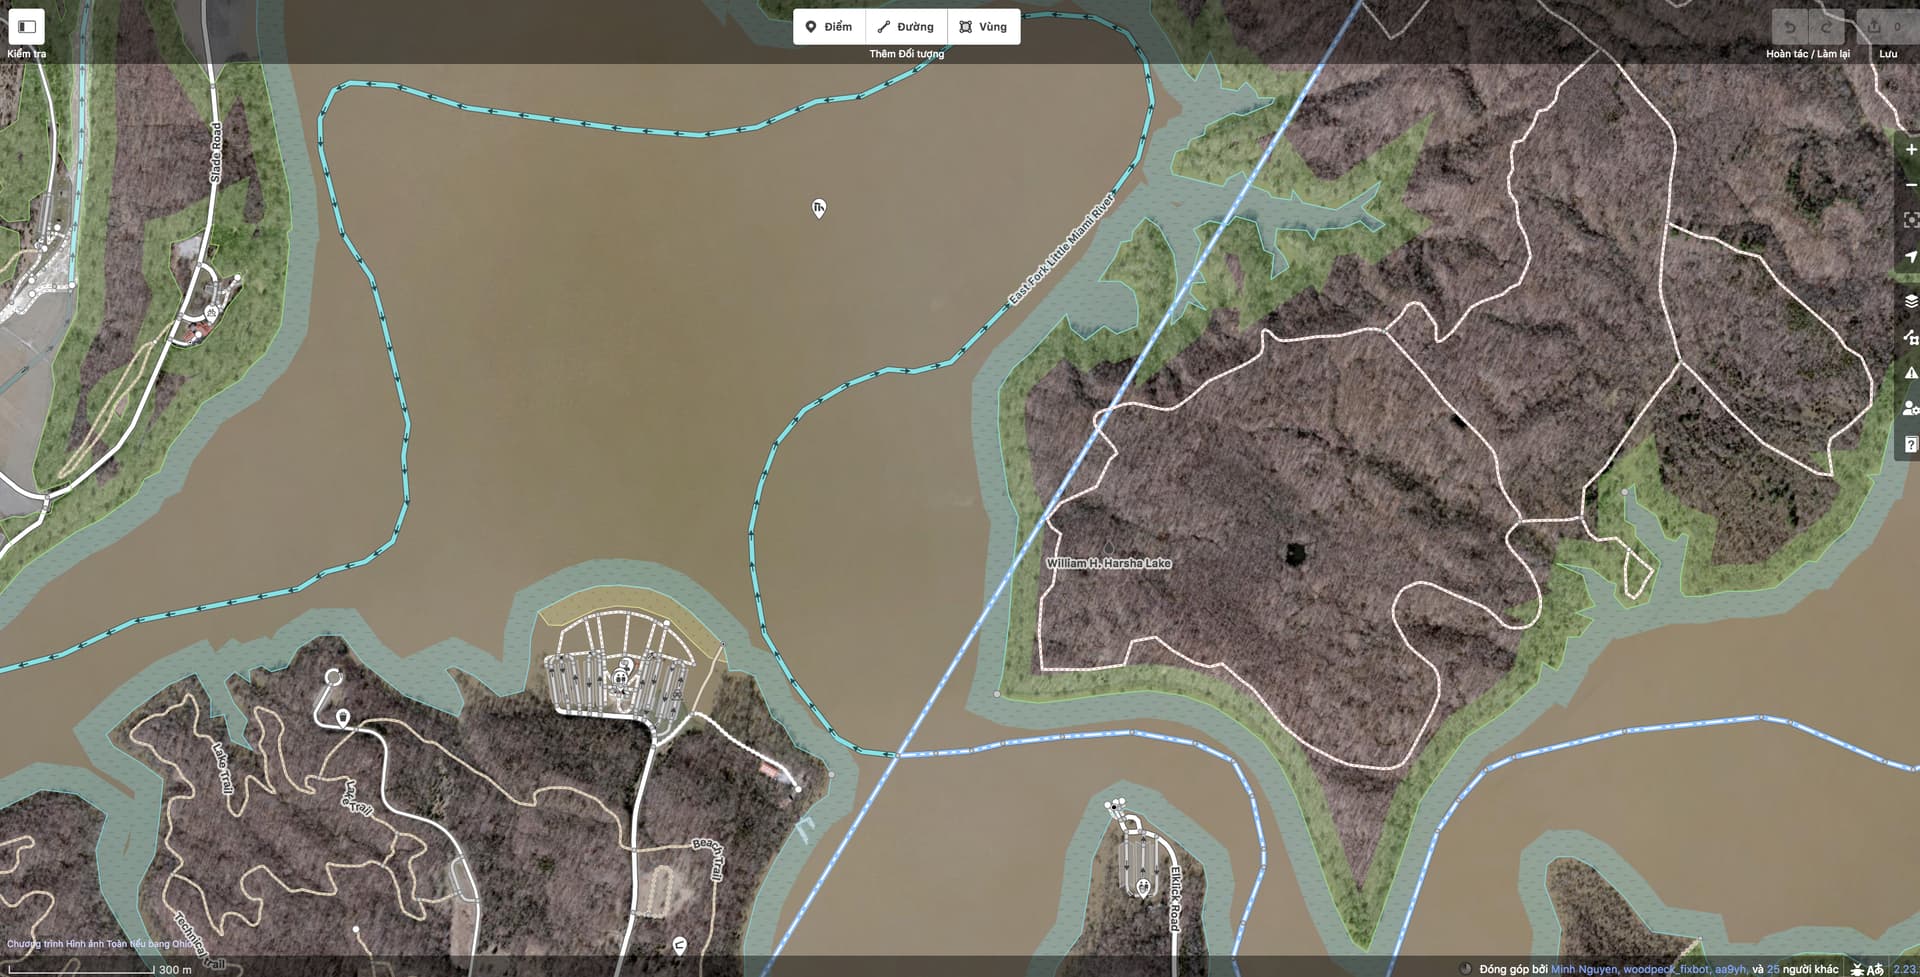
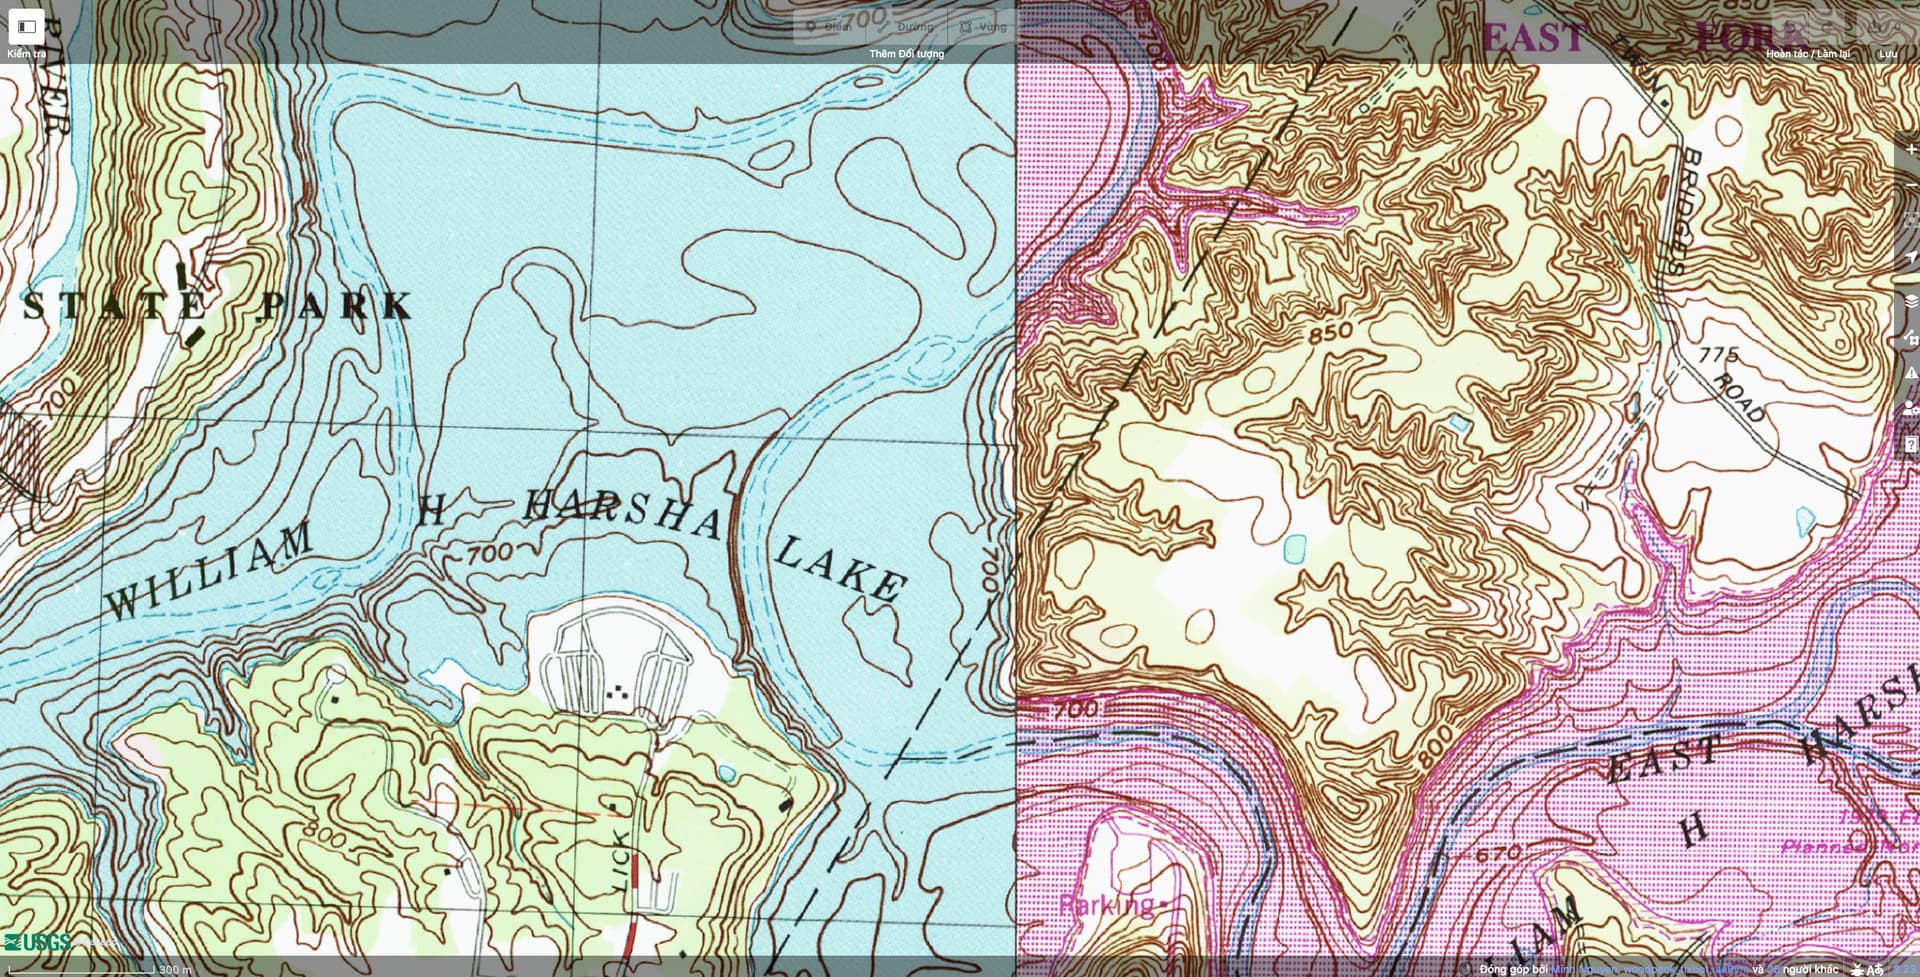
As a sidenote, mapping the thalweg is especially useful for rivers that run through reservoirs, as in the Lake Mead example earlier. An algorithmically generated lakeline has no context about where the river ran before the valley was inundated. In my own mapping, I’ve used public domain topographic maps or existing boundaries to determine where the thalweg ran. In cases where no such sources are readily available, eyeballing based on the lakeshore is certainly better than nothing. And ultimately the river channel may not be so great for labeling anyways, as in this reservoir that inundated quite a meander:
It’s still not random, nor just to indicate where the label should be or where to sail exactly. I don’t exactly know how it’s worded in the wiki, but from what I see mappers do try to map the middle line just as a way representing a road is drawn in the middle. I think estimating is fine for this, it will approximate a calculated middle line well enough.
A canal, no problem finding the centerline there. Elongated bodies of water with irregular outlines could be harder, but still I think a reasonable centerline can be drawn on sight. You just picture the area leaving out all the small details, think of crossing lines and put nodes in the middle of the imaginary crossing lines.
With a large irregular area, you probably would do the same: first reduce the outline to lose details which shouldn’t determine the centerline. Then sort of picture crossing lines and pick the middle points of those. I imagine these would not form a simple line, but a cloud of dots. A “center cloud”. Then I imagine you could apply the same procedure to find the center (point or line) of the “center cloud”.
I can see problems arising when e.g. large Islands or peninsilas are present, which may or may not be deemed important, and importance may be dependent of zoom level.
And, what if the information is attached to a centerpoint or centerline, but you are focussed/zoomed in on an area that does not contain the centerpoint or centerline?
A point cloud is not really fundamentally different from a polygon. A renderer would draw an envelope around the points, make a polygon, then skeletonize it to effectively produce a line, or else centroid it to come up with a point. And if we’re talking rough polygons then I think that’s a slippery slope to a beast megapolygon.
At that point, you’re zoomed in beyond the level where it’s appropriate to show a label. Take a look at what other commercial digital maps do in this exact case. A smart renderer is only rendering ocean labels at ocean-level zoom, sea labels at sea-level zoom, etc.
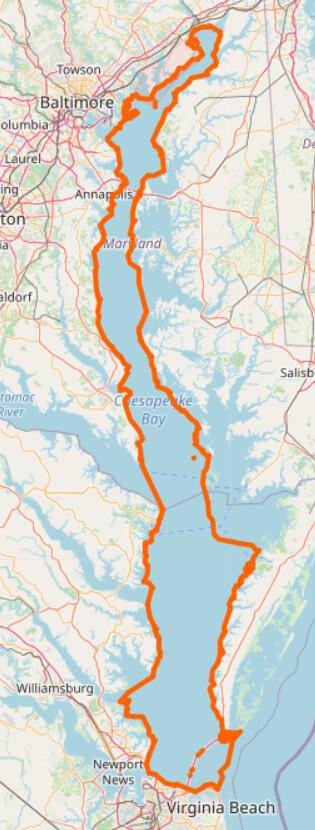
 but the fans on my quad-core did kick up a few notches after I clicked the link to display Chesapeake Bay.