Yes, it works exactly like that. The algorithm checks, whether there are enough (even small) patches of landuse or natural within a hexagonal cell to classify it as certain landcover type. If there are, the cell gets classified and is considered as fully covered. The current thresholds are 10% for urban areas and 1% for all other areas. If there is not enough data to classify the cell, it is considered as blank.
Indeed, the resulting assessment is quite optimistic. But it’s the way the generalization works: we what to move from small patches to the big picture. For the geographical areas where my knowledge are sufficient, this algorithm gives quite satisfactory results.
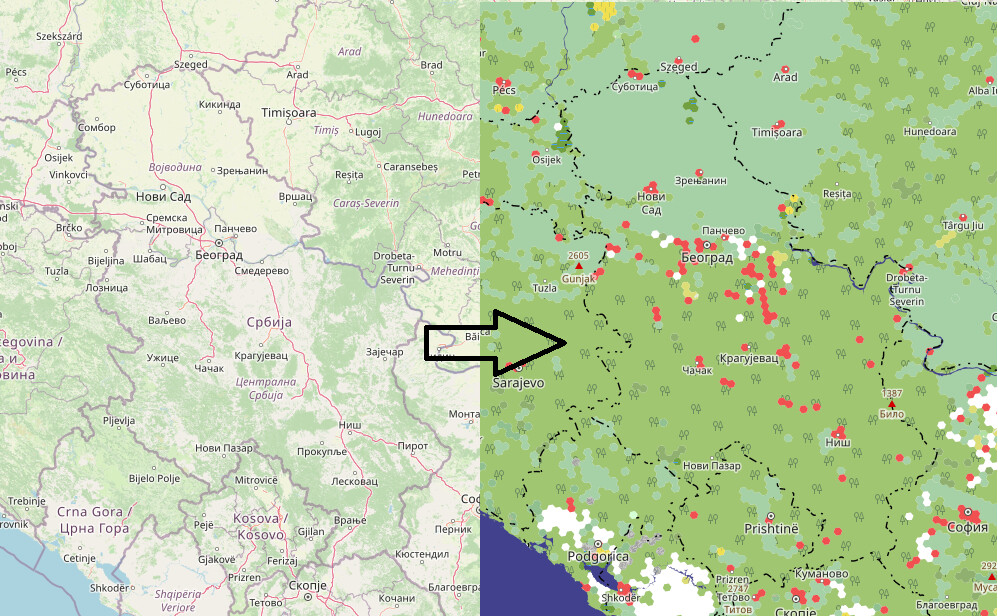
@Duja, the question from my side: does the map on the right make sense in your opinion? With farms and fields in the north and woods in the south? Or is it wrong?
I agree, coverage percentage of original, non-generalized polygons can be also interesting. I’ve started the calculation process up, but it can take days or even weeks to get some results. I will keep you informed.
I think the risk of such a low threshold for rural areas is that there may be a bias towards mapping “unusual” land covers for a particular area more thoroughly than “boring” land covers.
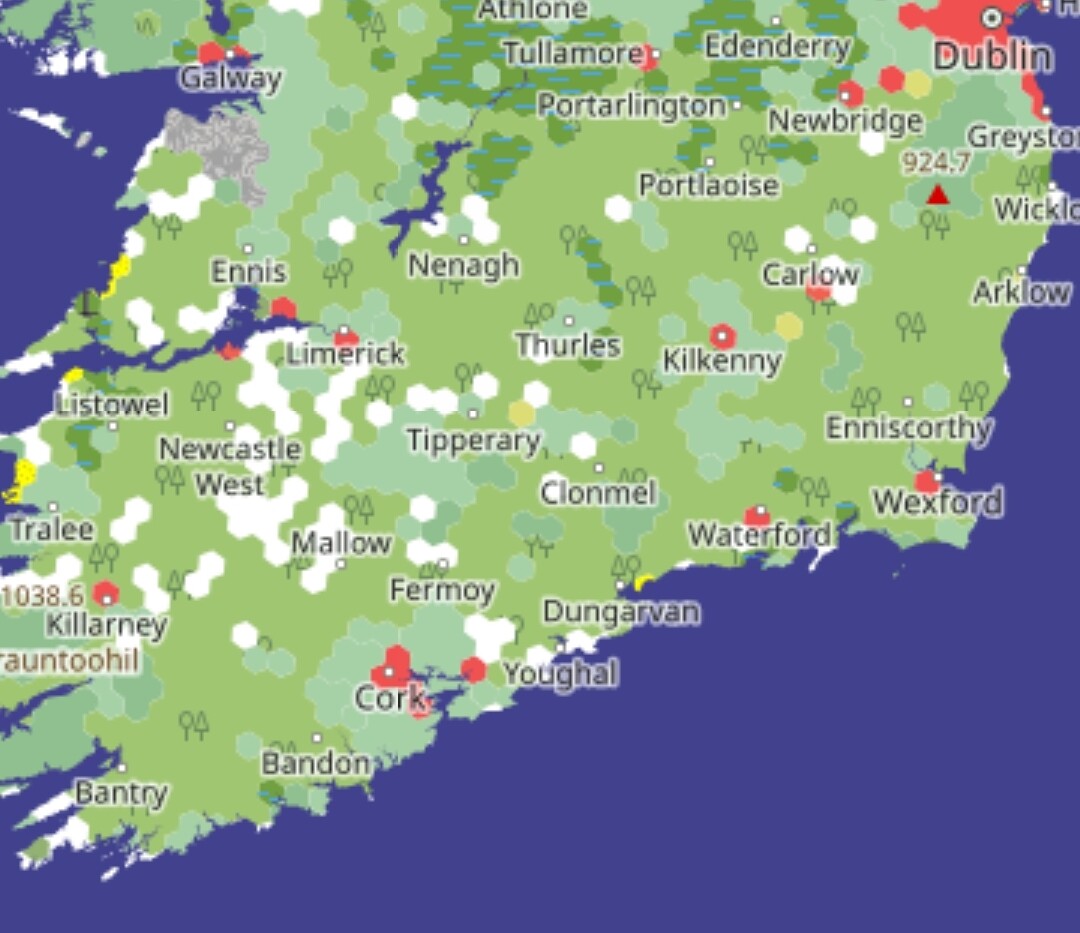
That seems to be the case in Ireland. Only about 12% of the Republic of Ireland is forested, but this map gives the impression of much more tree cover. Especially the southern half of the country looks like it is dominated by forest.
I think this is because almost all forests are mapped, probably because they are unusual and also easy to map from imagery. Meanwhile there is less interest in filling in the 80-90% of land covered by pasture or farmland. So a tile mapped with 2% forest and nothing else probably really is 2% forest, but that gets expanded to the whole tile (if I understand correctly).
In contrast the topmost strip of my screenshot works quite well, as there happens to be a lot of quite specific land cover mapped there: the bogs in the centre of the country, the bare rock in County Clare, and the urban areas of Dublin and Galway are all immediately recognisable to me.
This is more or less what happened in Serbia as well: there was an import of forest cover from CORINE some 10-15 years ago but no other landcover type. Landcover of the northern fertile plains with barely any forest (i.e. mostly landuse=farmland) has been populated only in the recent years (my pet project), but only bits exist in the rest of the country. That’s why the south looks fully covered by forest by your algorithm, although in reality there’s only some 30-40%, the rest being (unmapped) meadows and farmland.
One other note about CORINE - whilst it might be a good fit for openlandcovermap, it can be problematical for OSM otherwise, as it is very broad-brush.
(Off-topic warning) Indeed, I hate it (somewhat). On one hand, the 10-year old import in my area has filled the map and provided a broad-brush information where the forests are (mostly) located. On the other, it hampered more precise mapping that could have been undertaken by local mappers. As the old story goes, it is typically harder to edit old and bad data than to delete it all and start from scratch.
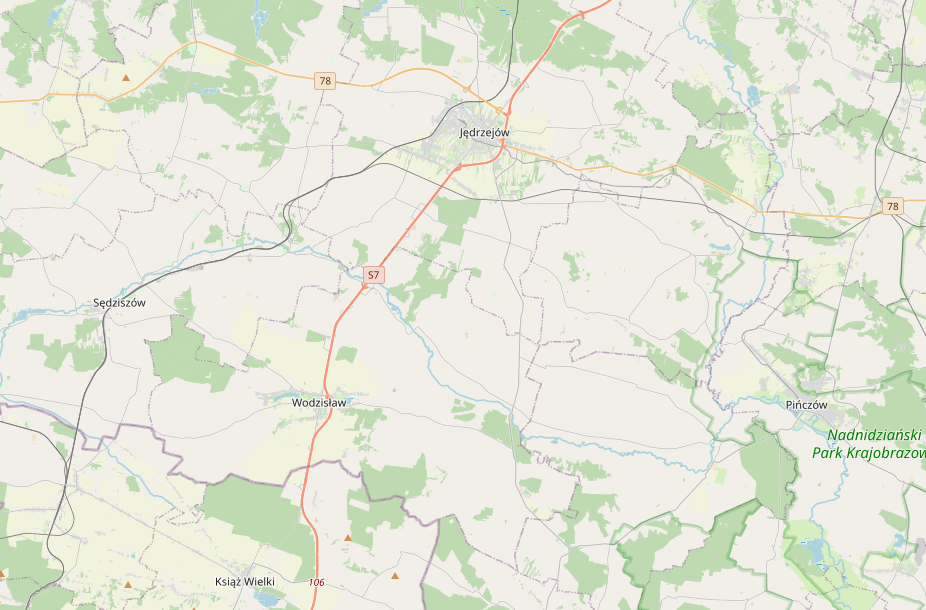
Compare, for example, the details of landcover and tracks hand-mapped by myself in Serbia [west] (c. 2023) with the one in neighboring Romania [east] mass-imported from CORINE or a similar source (c. 2015, there was a conscious decision by Romanian mappers I once read and could dig up). While they “filled in the gaps” much earlier, there’s a disincentive to local mappers to replace that crude import with something that more closely resembles reality.
@Duja , @alan_gr
thank you very much for the comments.
Probably I can increase threshold values, then we’ll see more empty spots on the generalized map and slightly smaller numbers in the country stats table, but it seems that it will not fix the core problem (and the problem is not really related with thresholds)
If the original data is biased than the generalized data will be biased too, or even more biased, because generalization sharpens the map features. Also the algorithm have to deal with the data which is present in OSM, there is no default landcover currently.
A funny thing is that if only 2% of woods are dominant , adding some farmlands require minimal efforts. However, if woods cover 30% of the territory and no farmlands have been mapped (which should be around 70% in reality), then significantly more farmland polygons need to be added to outnumber the forests.
My suggestion is to move forward and add the missing landcovers, even if they are boring.
Maybe there should be some kind of weighs? For example multiply forest coverage by 0.5? So area covered in 20% with forest, 11% by mapped farmlands, 9% by built-up areas, 60% unmapped farmland gets classified as farmland - not as a forest.
These suggestions are all fine and good but it really depends on if the goal is to make a map that looks “correct” at low zoom or to just say “it is what it is, go map more if you want it to look more as you’d expect”.
It’s not clear to me that it depicting all forests is wrong if your goal is the second one. FWIW, I love a map that looks “unexpected” because that’s a map that points us to more work to be done. Up to @Zkir I suppose.
I’ve did some experiments with threshold values, and came to conclusion that increasing thresholds does not make the map any better and cannot solve the problem with original data significantly biased.
But we can make better: display several analytical layers, like cell filled rate, so original polygon densities will be visible, and possible areas for landuse/natural improvements will become obvious.
For example, cell filled rate = non-generalized polygon density:
We now have daily (nightly) updates. The process starts around midnight UTC, and completes about 04:00 UTC ( tiles and file extracts are uploaded to the site). Timestamps can be seen on the downloads page.
Implementing regular updates took a bit longer than I’ve expected, because Linux is a very strange thing. Environment disappears if activated from cron job etc.
Further plans:
Add a legend. Ideally I need to find some way to render it programmatically, otherwise it will never match actual map.
Make landcover classification (or at least it’s description) a bit more consistent.
Add analytical layers/quality metrics, as mentioned above.
Try existing generalization features of osm2pgsql
Render something on z9-z18.
Obviously, all the above are not commitments, but desires for the case if I live long enough and enthusiasm allows