Announcement: OpenLandcoverMap

I wouldn’t try to address faulty data too much. Making it obvious that data is flawed ought to improve the map in the long run.

3 Likes

Noticed some odd mountains on low z. Grandview, 7784 and Morro do Mirante 8165. The latter is 816m in OSM data, so exactly a factor of 10 off. I don’t see any unusual tags on these.

It’s from previous version of that object. Online map has not updated yet.

Generally speaking, there are a lot of erroneous elevation values, just because nobody can see them.

1 Like

image
:wink:

1 Like

My focus is to provide general, fast, and easy-to-use mechanisms for OSM data generalizations, that’s not tied to specific zoom levels. I love to see more people working on stuff like that and discuss it, so it is great that you are experimenting there. I’d also be interested if there is anything we can provide (or you want to add to) osm2pgsql, because I think osm2pgsql/PostgreSQL/PostGIS is a great platform for generalization work.

3 Likes

The map is updated. But there are some other suspicious mountains. It seems that they prefer feet in US (despite ele=* definition) , so hills are three times higher then in Europe.

@Wulfmorn I’ve thought of it!
I’ve thought that maybe I can make an Earth Map for Civilization 6 game solely from OSM data, especially since maps in Civ6 are based on the same hexagonal grid and format is open, so it could be a simple export script.


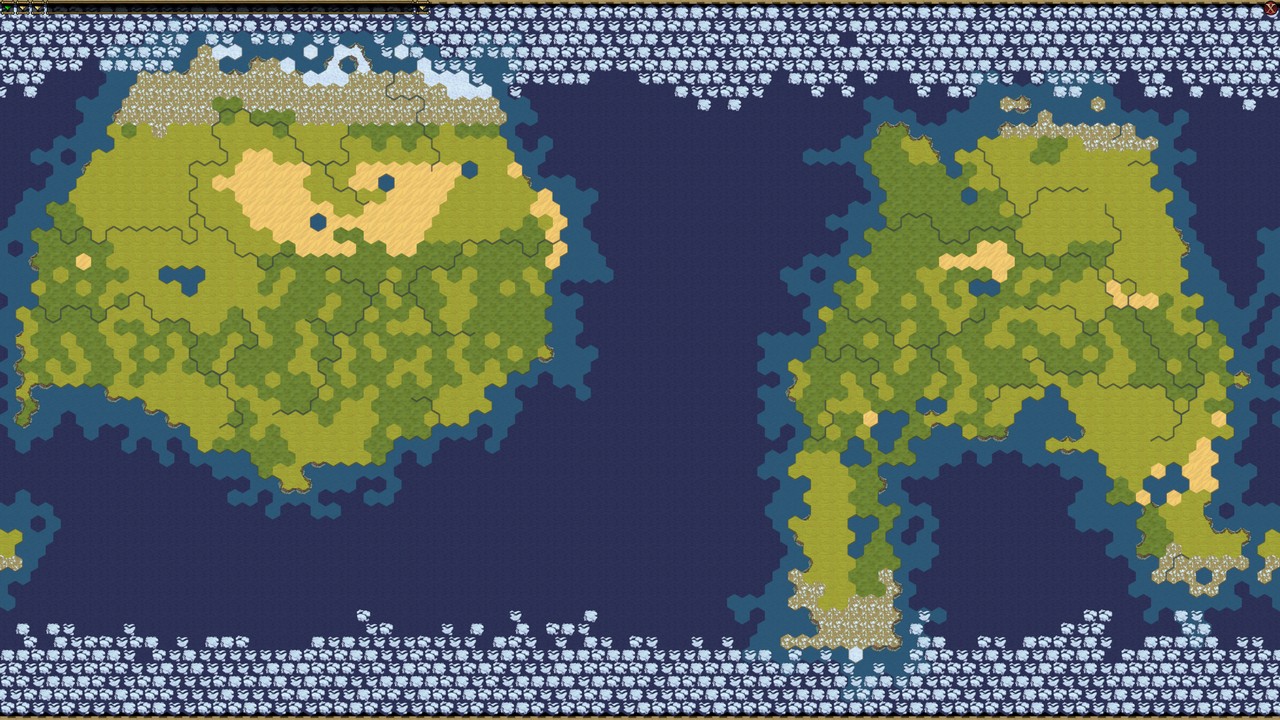
(random map form Civ6 game)

However, despite that geography model is very primitive in Civ6, we still do not have relevant data in OSM for that.

There are just 5 types of terrain in Civ6, which are rather types of soil:
SNOW (permafrost)
TUNDRA
GRASSLAND (more fertile soil)
PLAIN ( a bit less fertile soil)
DESERT

3 types of “features”:
FOREST
JUNGLE
WETLAND

and three types of relief:
FLAT
HILLS
MOUNTAINS

As simple as that!

However, in OpenStreetMap we do not yet have permafrost and tundra mapped, no distinction between “grassland” and “plain”, and no distinction between woods and jungles (we still argue about woods vs forests, and only 10% of woods have tags specifying leaf types), to say nothing of the white spots. Luckily, wetlands are present in abundance in OSM :slight_smile:

There are occasional natural=hills and natural=mountain|massif, but i suspect they do not form consistence coverage.

4 Likes

I did some overpass queries to find and fix some obvious feet elevations, but there is probably room for a more systematic treatment.

2 Likes

If someone took the ~600,000 natural=peak objects with ele, which isn’t really a lot of data, and made a public site with semi-regular updates for “top 100 peaks by country” or the like, the OSM data would probably get a lot cleaner in a matter of just a few months.

7 Likes

Great!

Well, this is exactly this project is aimed for. :slight_smile:
I can create a tile layer with mountain peaks only, without landcovers and cities, like this:

If one zooms to a country, he/she will see the most important peaks and can see whether it is correct or not. I do not like to do that in a text format, long lists seems to be dull.

However, someone should help me with frontend, and make a panel with switches to select layers. Any library will do. I am struggling with that, JavaScript never has been my strong side :slight_smile:

1 Like

Long lists are boring, but I created one for you :slight_smile:

This page shows what percentage of a country’s territory is covered by generalized landcovers.

image

Most European countries are ~100% covered, worst is Albania (just 54%). Korea and Japan are 99% covered. In Africa Cameroon and Gabon are ~100% mapped (I am curious, was it some import?).

The most poorly rendered country is Mongolia, with only 7% coverage.

Comrades from Albania and Mongolia, catch up! :smiley:

For those who prefer visual representations, here’s a map::

(Disclaimer: country outlines from Natural Earth are used)

2 Likes

May I ask about specifics of the algorithm? For example, it shows Serbia at 99%, while it has quite sizable swaths of bare map, such as this. It seems it works on the principle “there is at least a small patch of landuse or natural within every NxN hexagon/square” which produces a rather optimistic assessment.

1 Like

Yes, it works exactly like that. The algorithm checks, whether there are enough (even small) patches of landuse or natural within a hexagonal cell to classify it as certain landcover type. If there are, the cell gets classified and is considered as fully covered. The current thresholds are 10% for urban areas and 1% for all other areas. If there is not enough data to classify the cell, it is considered as blank.

Indeed, the resulting assessment is quite optimistic. But it’s the way the generalization works: we what to move from small patches to the big picture. For the geographical areas where my knowledge are sufficient, this algorithm gives quite satisfactory results.

@Duja, the question from my side: does the map on the right make sense in your opinion? With farms and fields in the north and woods in the south? Or is it wrong?


I agree, coverage percentage of original, non-generalized polygons can be also interesting. I’ve started the calculation process up, but it can take days or even weeks to get some results. I will keep you informed.

I think the risk of such a low threshold for rural areas is that there may be a bias towards mapping “unusual” land covers for a particular area more thoroughly than “boring” land covers.

That seems to be the case in Ireland. Only about 12% of the Republic of Ireland is forested, but this map gives the impression of much more tree cover. Especially the southern half of the country looks like it is dominated by forest.

I think this is because almost all forests are mapped, probably because they are unusual and also easy to map from imagery. Meanwhile there is less interest in filling in the 80-90% of land covered by pasture or farmland. So a tile mapped with 2% forest and nothing else probably really is 2% forest, but that gets expanded to the whole tile (if I understand correctly).

In contrast the topmost strip of my screenshot works quite well, as there happens to be a lot of quite specific land cover mapped there: the bogs in the centre of the country, the bare rock in County Clare, and the urban areas of Dublin and Galway are all immediately recognisable to me.

6 Likes

This is more or less what happened in Serbia as well: there was an import of forest cover from CORINE some 10-15 years ago but no other landcover type. Landcover of the northern fertile plains with barely any forest (i.e. mostly landuse=farmland) has been populated only in the recent years (my pet project), but only bits exist in the rest of the country. That’s why the south looks fully covered by forest by your algorithm, although in reality there’s only some 30-40%, the rest being (unmapped) meadows and farmland.

3 Likes

One other note about CORINE - whilst it might be a good fit for openlandcovermap, it can be problematical for OSM otherwise, as it is very broad-brush.

3 Likes

(Off-topic warning) Indeed, I hate it (somewhat). On one hand, the 10-year old import in my area has filled the map and provided a broad-brush information where the forests are (mostly) located. On the other, it hampered more precise mapping that could have been undertaken by local mappers. As the old story goes, it is typically harder to edit old and bad data than to delete it all and start from scratch.

Compare, for example, the details of landcover and tracks hand-mapped by myself in Serbia [west] (c. 2023) with the one in neighboring Romania [east] mass-imported from CORINE or a similar source (c. 2015, there was a conscious decision by Romanian mappers I once read and could dig up). While they “filled in the gaps” much earlier, there’s a disincentive to local mappers to replace that crude import with something that more closely resembles reality.

4 Likes

@Duja , @alan_gr
thank you very much for the comments.

Probably I can increase threshold values, then we’ll see more empty spots on the generalized map and slightly smaller numbers in the country stats table, but it seems that it will not fix the core problem (and the problem is not really related with thresholds)

If the original data is biased than the generalized data will be biased too, or even more biased, because generalization sharpens the map features. Also the algorithm have to deal with the data which is present in OSM, there is no default landcover currently.

A funny thing is that if only 2% of woods are dominant , adding some farmlands require minimal efforts. However, if woods cover 30% of the territory and no farmlands have been mapped (which should be around 70% in reality), then significantly more farmland polygons need to be added to outnumber the forests.

My suggestion is to move forward and add the missing landcovers, even if they are boring. :slight_smile:

More empty spots might help fix the core problem - because it incentivises us to map more boring landcovers :slight_smile:

3 Likes

OK, will try that in the next update :slight_smile:

In the mean time, I’ve managed to add estimation of original landcover (i.e. set of natural and landuse) polygons per country.

http://openlandcovermap.org/country_stats.html

Just for your convenience small extract:

Country or territory Generalized coverage Original coverage
Germany 100% 85%
Serbia 99% 58%
Ireland 92% 25%
Mongolia 7% 3%
1 Like

Poland gets the same.

This empty area is basically all farmland.

Maybe there should be some kind of weighs? For example multiply forest coverage by 0.5? So area covered in 20% with forest, 11% by mapped farmlands, 9% by built-up areas, 60% unmapped farmland gets classified as farmland - not as a forest.

1 Like